

More screen space won’t resolve control room situational awareness problems when applications, alerts, and video feeds remain fragmented. Large scale display systems for data visualization should help teams build a shared, current view, bring priority information into context, and support timely decisions without adding to operator overload.
A control room may already have screens showing multiple feeds. The remaining question is whether the information is connected, prioritized, and available to the people who need it.
This guide explains how to evaluate systems by the operational clarity and coordination they support, not by display specifications alone. You’ll learn what to assess in application integration, information prioritization, and escalation workflows, and how to plan for a common operating picture across teams and locations. Activu’s vis/ability platform brings applications and data streams together to support event-driven situational awareness, with relevant information available through video walls and to remote and mobile users. The goal is to give people the context they need to make informed decisions.
Key Takeaways
- Start with operational gaps: identify fragmented applications, data silos, and where alerts or information fail to reach the people who need them.
- Assess large scale display systems for data visualization by how they organize information and support coordinated decisions, not by screen count alone.
- Compare display-led, dashboard-led, and integrated approaches across application integration, prioritization, shared visibility, escalation, and access between locations.
- Map teams, decisions, data feeds, and escalation paths before selecting a system, then validate it against representative workflows.
- Consider how vis/ability can bring operational applications and data streams into a shared view, with visibility extending to remote and mobile users.
Why large-scale data visualization fails when operations remain fragmented
Fragmented applications, data silos, and unclear escalation paths can leave operators assembling an operational picture from separate, partial views. One system may show an alert, another may hold related information, and a third may provide wider context. When those sources do not connect, people have to bridge the gaps while operations continue.
Operational situational awareness is a team’s shared understanding of what is happening, why it matters, and what may require attention next. That understanding depends on more than access to information. Operators need context to judge relevance, and teams need a way to share that context.
How disconnected feeds create control room situational awareness problems
During an active operation, an operator may move between applications to check an alert, review related information, and understand how a situation is changing. Each view may be useful on its own, but switching between them makes it harder to compare information at a glance. Colleagues in other locations may also be looking at different parts of the same event.
Seeing information is not the same as understanding its operational relevance. A notification is more useful when people can assess it alongside related data and identify who needs to know. Without that context, each operator may be interpreting a separate slice of the situation instead of contributing to a shared operating picture.
Why operators miss incidents when information lacks context
An alert without related information can be difficult to prioritize. If teams must identify connections manually, fragmented workflows may delay shared awareness or escalation. This does not mean a particular incident will be missed. It means decision-makers should examine where context, ownership, and escalation could break down.
Existing screens may seem sufficient because they already show multiple feeds. But more visible information does not connect systems or determine which item warrants attention. When evaluating large scale display systems for data visualization, start with the operational need: What information do operators need, when do they need it, and who needs visibility? The answers help define the requirements before teams decide how information should appear.
A video wall can provide a shared surface for information, but it is not a substitute for integration or context. Evaluate what connects the sources, how relevant information is brought forward, and whether the right people can access it.
How large-scale data visualization turns into a shared operational picture
When applications and data remain separate, teams have to connect information across tools themselves. A shared operational picture requires relevant applications and data streams to come together so people can assess what matters and use that context to make decisions.
That distinction matters when evaluating large scale display systems for data visualization. The display is the surface where information appears. An operational intelligence layer connects information, supports prioritization, and helps teams share awareness. Activu’s vis/ability platform brings applications and data streams into a unified operational view that can be displayed on a video wall.
What an operational intelligence layer does
As a central hub, vis/ability aggregates applications and data streams to support a unified operational view. Its event-driven situational awareness helps bring relevant information forward as events unfold. Before selection, confirm that the platform’s integrations and workflows support the sources, users, and operational requirements in your environment.
A practical evaluation follows the information from source to decision: identify which tools contribute data, check how the platform brings those sources into a shared view, and assess whether users can find the context they need. Prioritization can help teams focus on relevant information instead of treating every feed as equally important. For broader display context, see this strategic guide to video walls. A research-based framework for evaluating data visualizations can also inform how teams assess whether information is presented effectively for its intended use.
How a shared view supports distributed teams
A common operating picture can support coordination beyond the primary control room. Teams in remote locations, conference rooms, breakout rooms, and huddle rooms can share relevant operational visibility. Mobile vis/ability can extend visibility to users away from those spaces, helping connect participants to the broader picture.
Shared visibility does not replace the judgment of operators or leaders. It gives them a more consistent basis for comparing information, coordinating across locations, and deciding what to do. When evaluating a system, identify which people need access, where they make decisions, and what information is relevant to their role.
Review Activu vis/ability platform details to understand how the platform brings applications and data streams into a unified operational view.
Compare large scale display systems for data visualization
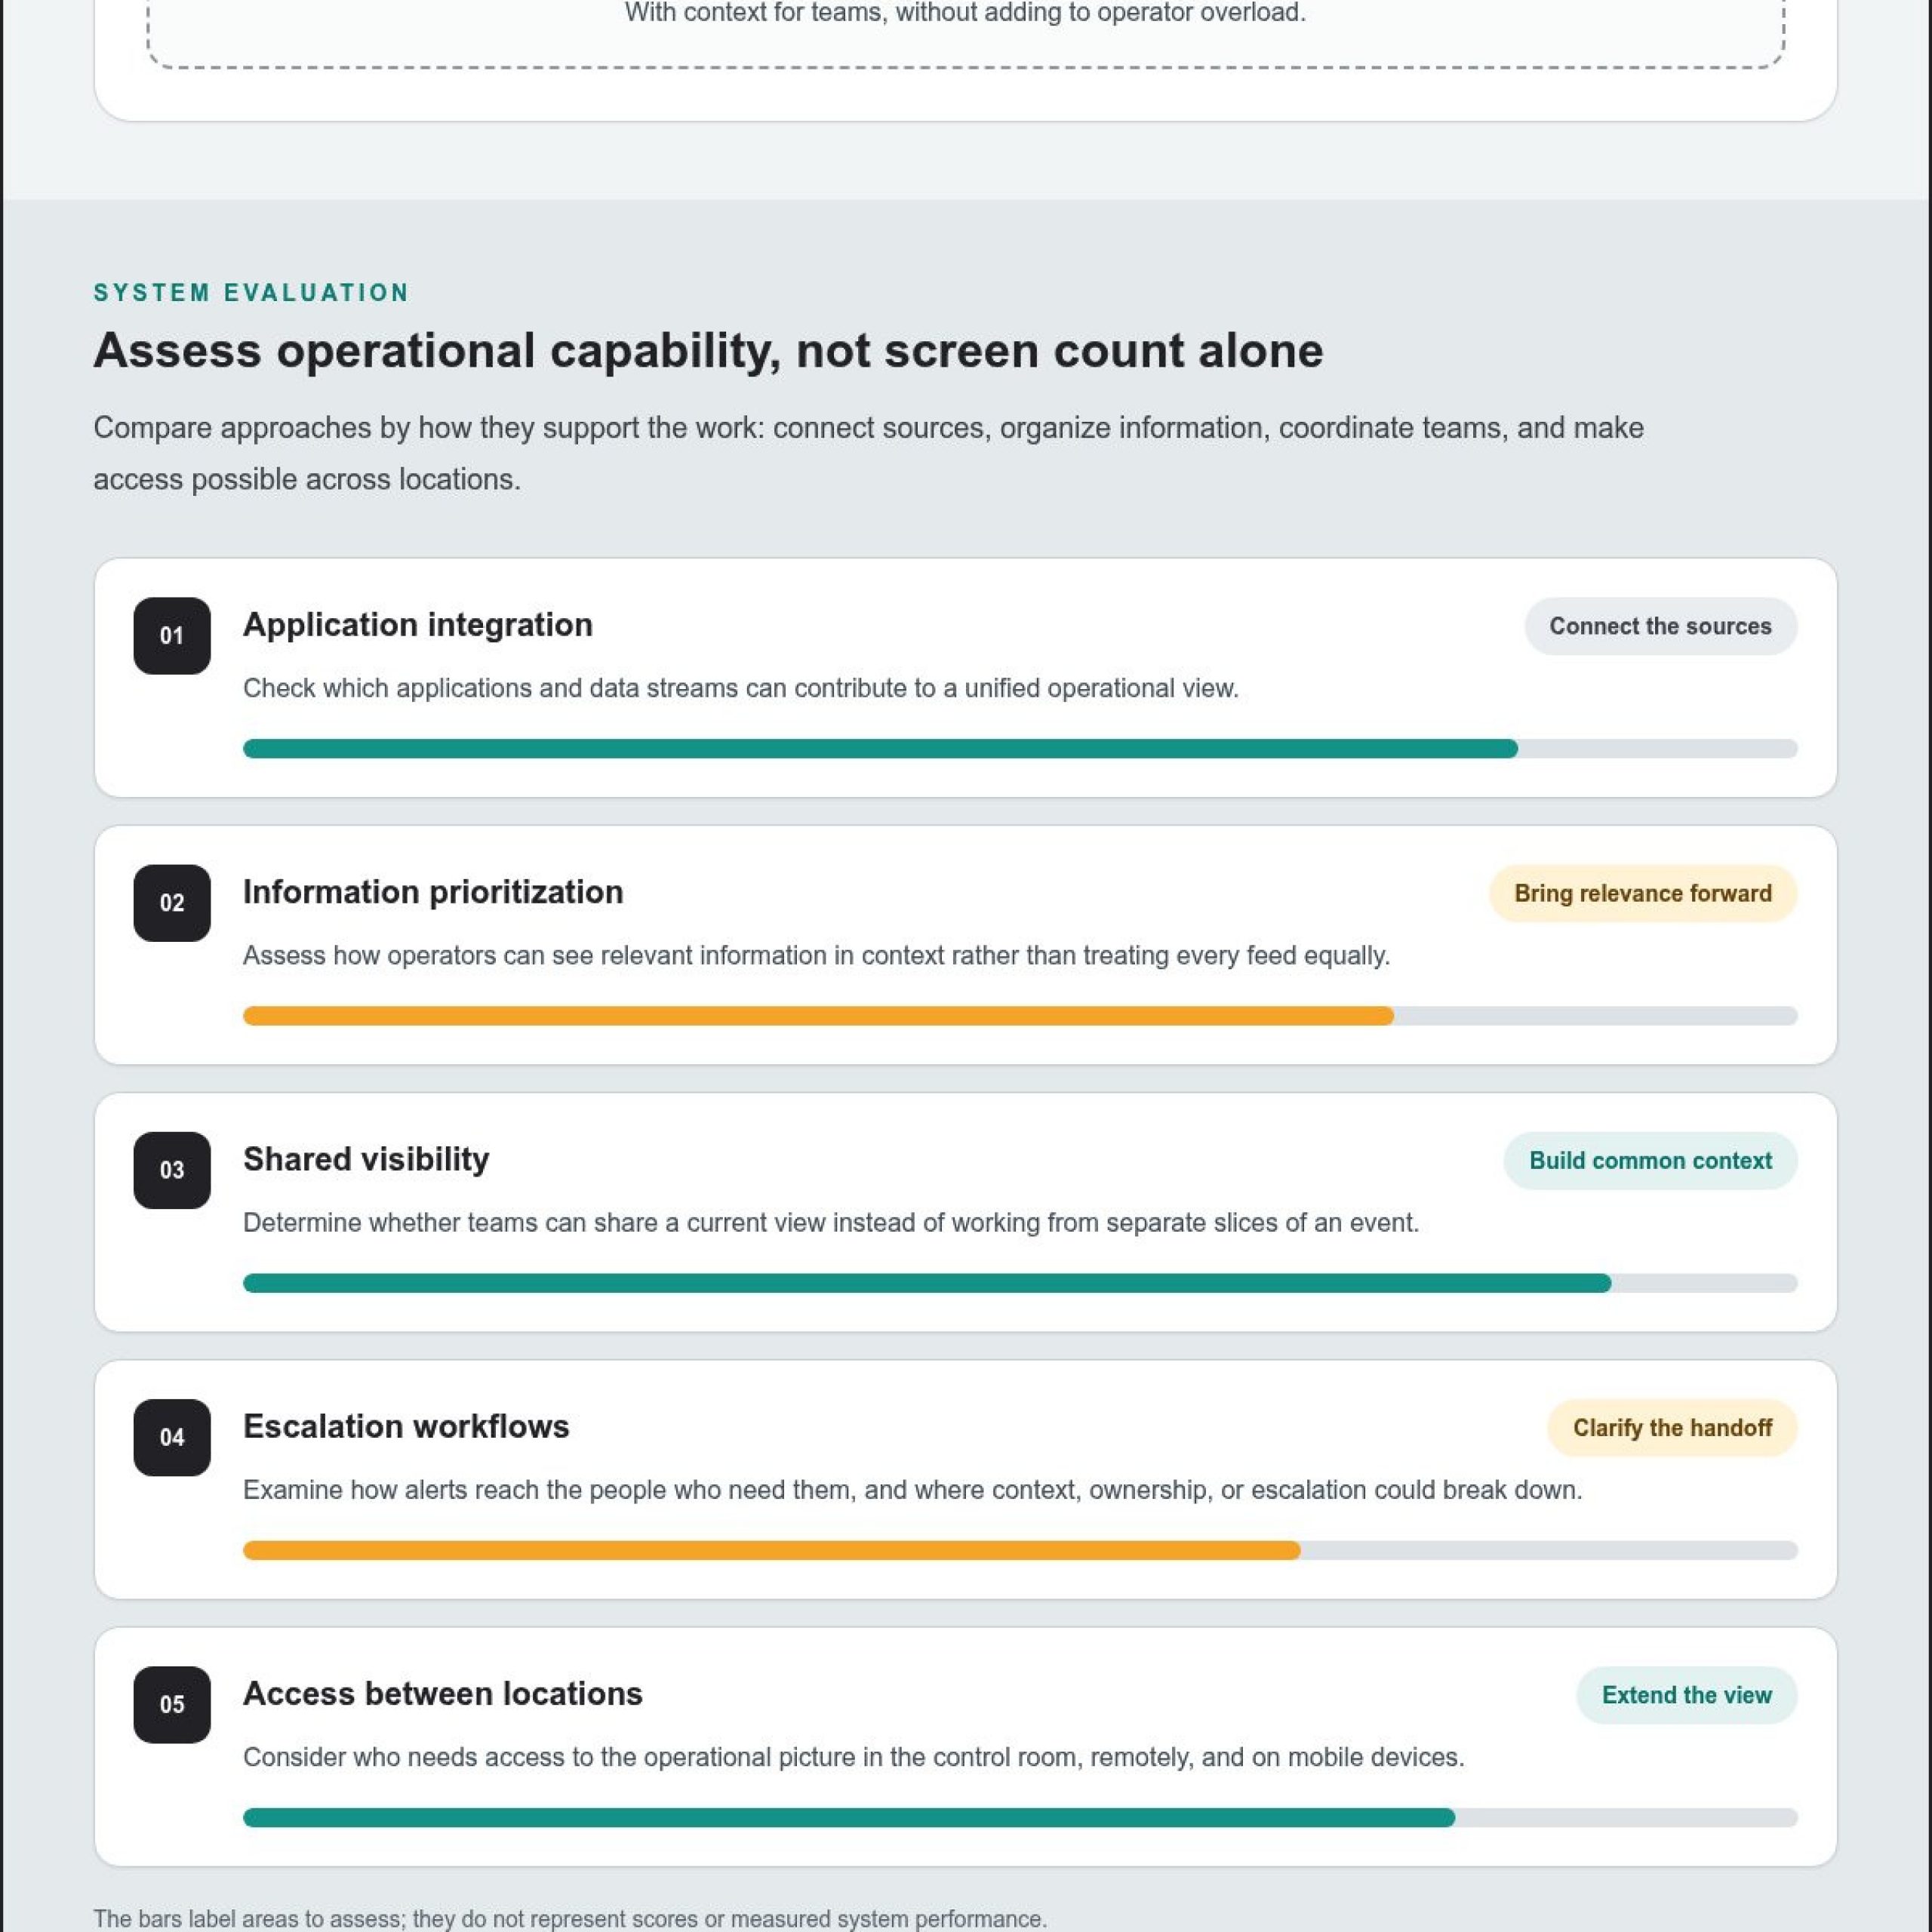
Fragmented applications, data silos, and unclear escalation paths can limit shared awareness, regardless of how much information a team can see. Evaluate large scale display systems for data visualization by how they support the work: connecting relevant sources, prioritizing information, sharing visibility, directing attention, and reaching people beyond the control room.
The approaches below are broad categories, not guarantees of a particular vendor’s capabilities. Check each function against your workflows and the systems you need to connect.
| Approach | Application integration | Prioritization and escalation | Shared visibility and access |
|---|---|---|---|
| Display-led | May present selected sources together. Check how sources connect and whether operators still need to switch between applications. | May rely on people to notice changes and decide what needs attention. | Can provide a shared view at the display location. Verify access for other teams and locations. |
| Dashboard-led | Can organize information within a dashboard. Check which operational tools and data streams it supports. | Assess how it distinguishes priority events and whether escalation workflows are supported. | Check whether views can serve different teams and decision contexts. |
| Integrated operational | Designed to bring operational applications and data streams into a unified view. Validate the integrations your operation requires. | Ask the vendor to demonstrate how event-driven visibility and escalation work in your workflows. | Assess whether teams can share relevant information across the control room, remote locations, and mobile users. |
A display surface alone does not resolve disconnected systems or information silos. It supports coordinated work when the overall approach helps determine what information appears, who needs it, and when attention should be directed. Research on scalable visualization techniques offers technical context for presenting large datasets. Operational buyers should also test whether a system supports their actual decision process.
Which evaluation criteria reveal operational fit?
Ask vendors to demonstrate your required applications and data streams in a unified operating picture. Follow a representative event through the workflow: how does relevant information become visible, who can access it, and how is attention directed? Ask what “automatic escalation” means in practice, and confirm the workflow with the vendor. Verify access for people outside the control room, including remote teams, and review integration requirements before selection.
When does an integrated platform add value?
A central hub merits consideration when teams depend on disconnected operational tools and need shared context across locations. Integration can help coordinate information, but it does not guarantee a particular response or outcome. For incident-focused workflows, consult this common operating picture guide.
- Score each approach: Mark whether it meets your needs for integration, prioritization, shared visibility, escalation, and access across locations.
- Validate the gaps: Record where a manual workaround is needed, then ask the vendor to demonstrate the relevant workflow.
How to evaluate and plan a data visualization system
Start by mapping the operation. Document the teams involved, the decisions they make, the applications and data feeds they use, and how information moves between people. Mark where data silos, manual handoffs, or unclear escalation interrupt shared awareness. This discovery grounds the evaluation in operational needs before you compare large scale display systems for data visualization.
What should a discovery workshop establish?
Bring together the people who use the information and the teams responsible for the systems. Trace recurring decisions and incident workflows from the first signal through review, coordination, and escalation. For each step, identify who needs the information, what context they need with it, and where they need to see it, including in the control room and other relevant locations.
Separate essential requirements from preferences. A preferred layout may help people work, but it should not obscure a core requirement such as bringing specified applications into a unified view. Record each requirement alongside its operational purpose, the person who can validate it, and any dependency that needs technical review.
How can teams validate a solution before deployment?
Use representative scenarios based on your organization’s workflows and approved data sources. Ask stakeholders to follow each scenario: what information appears, how users assess its relevance, who can access it, and what happens when attention needs to be directed or escalated. Involve technical teams early to review integration scope, access requirements, security assumptions, and deployment dependencies.
Define evaluation measures with your organization rather than relying on generic benchmarks. For example, assess whether users can find the required context, whether agreed sources are available, and whether information reaches its intended audience. Set the criteria in advance, then document gaps and unresolved questions from each validation session.
- Discover: Map teams, decisions, workflows, applications, data feeds, and escalation gaps.
- Prioritize: Specify what information matters, where it should appear, and who needs visibility.
- Validate: Test representative scenarios and review integration, access, security, and deployment assumptions with technical stakeholders.
Once those needs are clear, decide how information should be presented, including whether a video wall is the right shared surface. The operational intelligence layer should support how information is brought together and displayed, while operators retain judgment over the response. For a planning resource focused on the environment and the people who use it, explore Activu’s control room design services.
How Activu connects operational intelligence to large-scale displays
Fragmented applications and data silos can leave teams without a consistent view of current operations. Selecting large scale display systems for data visualization should start with how people need information to coordinate, not with the display alone.
Activu’s vis/ability platform is designed to bring operational tools and information together. It integrates applications and data streams into a unified operational view, with relevant information available through video walls. This approach connects application integration with the environment where teams need shared visibility.
How vis/ability brings operational information together
vis/ability is an operational intelligence layer that can surface information through a video wall. It aggregates applications and data streams to support a unified operational view and event-driven situational awareness. Discuss the specific integrations, workflows, and escalation requirements needed for your environment with Activu.
The roles are distinct: applications and data streams supply operational information, vis/ability brings that information into a shared view, and the video wall gives teams a place to see it together. Operators and leaders still apply the judgment that turns information into action.
What to discuss with Activu before selecting a system
Bring the details that define your operational requirements. A focused discussion can cover:
- Workflows: Which recurring decisions and incident processes depend on shared visibility?
- Sources: Which applications and data streams need to contribute, and what integration requirements should technical stakeholders review?
- Users and locations: Who needs access in the control room, remote locations, conference rooms, breakout rooms, huddle rooms, or on mobile devices?
- Escalation: What information should prompt attention, and who needs to receive it?
Visibility across these settings can help distributed teams work from a more consistent operational picture. Activu offers mobile vis/ability alongside its platform, as well as control room design services. This system-level approach connects operational needs to how information is integrated, shared, and presented, rather than treating hardware as a standalone purchase.
Activu has specialized in visualization and collaboration for mission-critical environments since 1983. To discuss your workflows, data sources, user groups, and escalation requirements, contact the Activu team about your control room requirements.
Build a clearer operating picture for the decisions ahead
Choose large scale display systems for data visualization by the operational picture they help create. Start with the information teams need, then test whether applications and data can be brought together, relevant events can be surfaced, and the right people can share visibility. A display surface matters when it presents information in the context of operational needs.
Activu’s vis/ability platform aggregates applications and data streams to support event-driven situational awareness. It serves as an operational intelligence layer that can surface information through a video wall, giving operators and decision-makers a connected view to inform their judgment.
Bring your workflows, data sources, user groups, and escalation requirements into the planning conversation. Discuss your operational requirements with Activu and explore how an integrated approach may support coordination across your teams.
Frequently Asked Questions
What is a large-scale display system for data visualization?
A large-scale display system for data visualization brings operational information into a shared view, often using a video wall as the visible surface. Its value depends on how applications and data streams are integrated, prioritized, and made available to the people who need them. Activu’s vis/ability platform aggregates applications and data streams to support a unified operational view that can surface through a video wall.
How do you manage multiple data feeds in a dispatch center?
Start by identifying the data sources operators use, what decisions each feed supports, and where teams need to share context. Then assess whether an integration platform can bring relevant applications and streams into a unified operating picture. Define how priority information should appear and who needs access. Confirm the integration scope and escalation requirements with technical stakeholders and the platform provider before relying on a workflow.
Do large-scale displays improve situational awareness on their own?
No. A large display can make information visible to a group, but it does not automatically connect data silos, explain an alert’s relevance, or direct attention to priority events. Situational awareness depends on context and shared understanding. Evaluate the operational intelligence layer behind the display: which sources it brings together, how information is presented, and whether the right users can access the view they need.
What should an EOC common operating picture solution include?
An EOC common operating picture solution should support the applications and data streams relevant to the organization, bring information into a shared operational view, and make it accessible to the teams that need it. Define how priority events should appear and what escalation means for your workflows. Validate integrations, user access, and deployment assumptions with operational and technical stakeholders instead of assuming every platform supports the same requirements.
Why might operators miss incidents when using a video wall?
Relevant information may be overlooked when feeds appear without context, priority alerts blend into other activity, or the information needed to interpret an event sits in a separate system. A video wall provides a shared surface, but it does not by itself resolve fragmented workflows or determine what deserves attention. Assess how the system connects related information and supports escalation, then verify those capabilities against actual operating procedures.
Can a data visualization system share information with remote and mobile teams?
Yes, if the platform supports access beyond the primary control room and meets the organization’s access requirements. Activu’s vis/ability extends operational visibility to remote and mobile users, as well as teams in collaboration spaces. Before selecting a system, identify who needs information at each location, which view is relevant to their role, and what technical requirements govern access. Confirm the proposed setup with your organization’s technical team.
How should an organization compare large-scale data visualization systems?
Compare systems against operational requirements, not screen count alone. Assess application integration, event-driven situational awareness, shared visibility, escalation, and access across locations. Use representative workflows to test what information appears, who can see it, and how attention is directed. Confirm capabilities with the vendor and document gaps that require manual workarounds. This helps determine whether a system supports your teams’ decisions and coordination needs.