
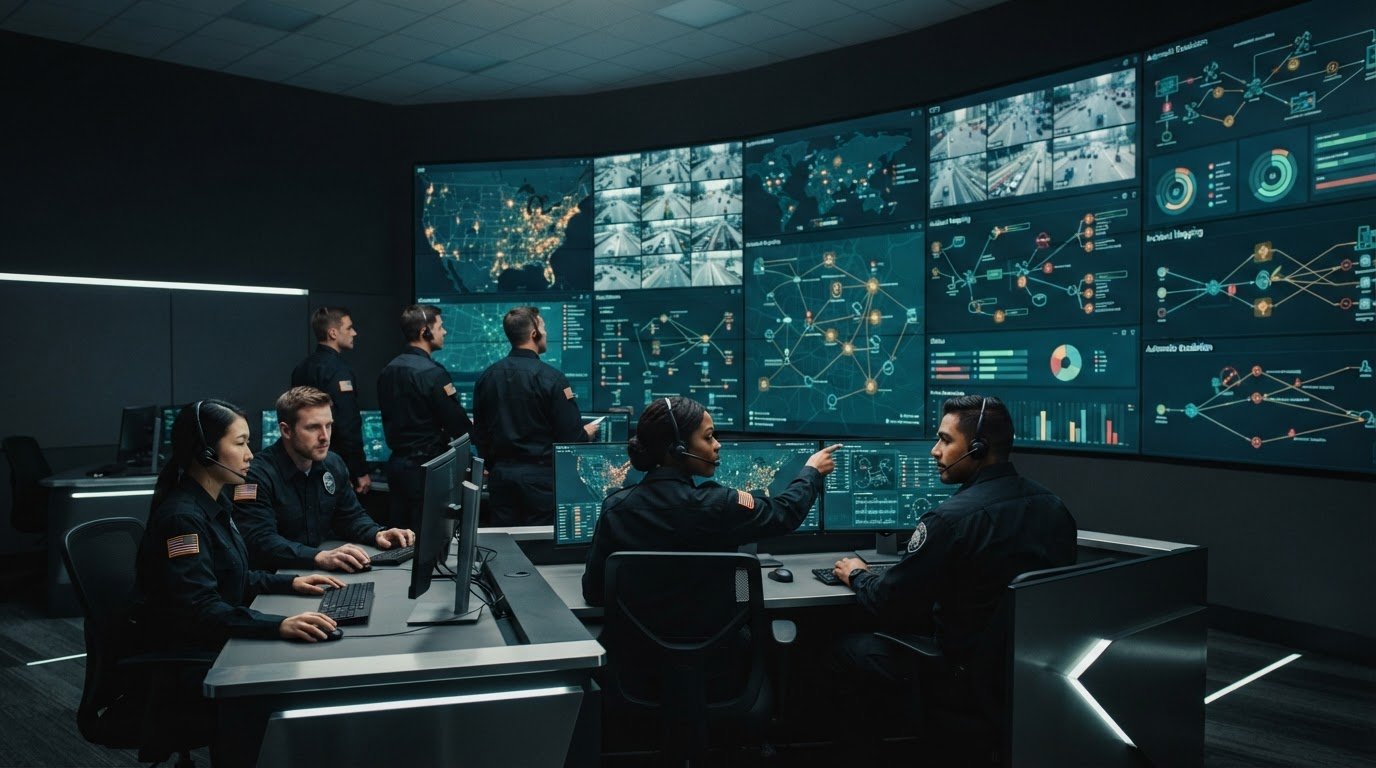
What if the biggest risk in a security operations center isn’t a missing alert, but the time it takes to connect that alert to the people and information needed to act? Security operations center visualization software can help address this gap, but only when it brings disconnected security signals and operational data into a shared view. Otherwise, operators must manually compare feeds, decide what deserves attention, and relay information across teams. Priority events can end up competing with background noise.
Most control rooms already have the screens. What they’re missing is the layer that decides what goes on them and escalates automatically when something needs attention. Security operations center visualization software should help teams organize and share priority information while leaving threat prediction to tools designed for that purpose.
This article explains the role and limits of SOC visualization and how to evaluate platforms for integration, escalation, and coordinated decision-making across locations and devices. It also explores vis/ability® as an operational intelligence layer that surfaces through the video wall, bringing relevant maps, video, dashboards, and event information into a shared view. The goal is a clearer path from fragmented signals to informed human action.
Key Takeaways
- Assess security operations center visualization software by how it supports real workflows, not by broad claims about AI or prediction.
- Separate analytics, alerting, visualization, escalation, and collaboration when comparing platform capabilities.
- Map data sources, alert paths, user roles, and operating spaces before reviewing interfaces.
- Use scenario-based evaluations to see how information moves from an initial signal to coordinated team decisions.
- Consider how a unified platform can bring operational tools and shared information together for teams across locations and devices.
Why Security Operations Center Visualization Software Must Address Fragmented Signals
A security incident rarely arrives as a complete picture. A SIEM may flag an event, a camera feed may show activity, and a map or operational dashboard may hold details that help explain the alert. When these systems sit in separate silos, analysts must navigate among them, compare information manually, and decide which signal deserves attention. The challenge is connecting evidence and establishing who owns the next step.
A control-room situational-awareness problem exists when teams can’t connect relevant signals quickly enough to form a shared, actionable understanding of an event. Competing alerts can make priorities unclear. If ownership is ambiguous, analysts may not know whether another team has acknowledged an issue or whether escalation is still needed. Relevant data may exist, but teams can still lack a shared understanding of what is happening.
How fragmented security feeds complicate SOC decisions
SOC analysts may move among SIEM alerts, video, maps, case data, and operational dashboards to investigate one developing situation. Each view can provide useful detail, but separate screens and workflows make comparison harder. A location on a map, a timestamp in an alert, and a related camera view may each describe part of the same event without appearing together.
The Security Operations Center (SOC) brings people, processes, and technology together for monitoring and incident response. Those components need to connect in practice. If one team sees an alert while another holds the relevant operational context, analysts need a clear way to share findings and assign follow-up. Otherwise, each person may work from a partial picture, and handoffs can leave gaps in what the next operator understands.
Why more dashboards do not automatically create clarity
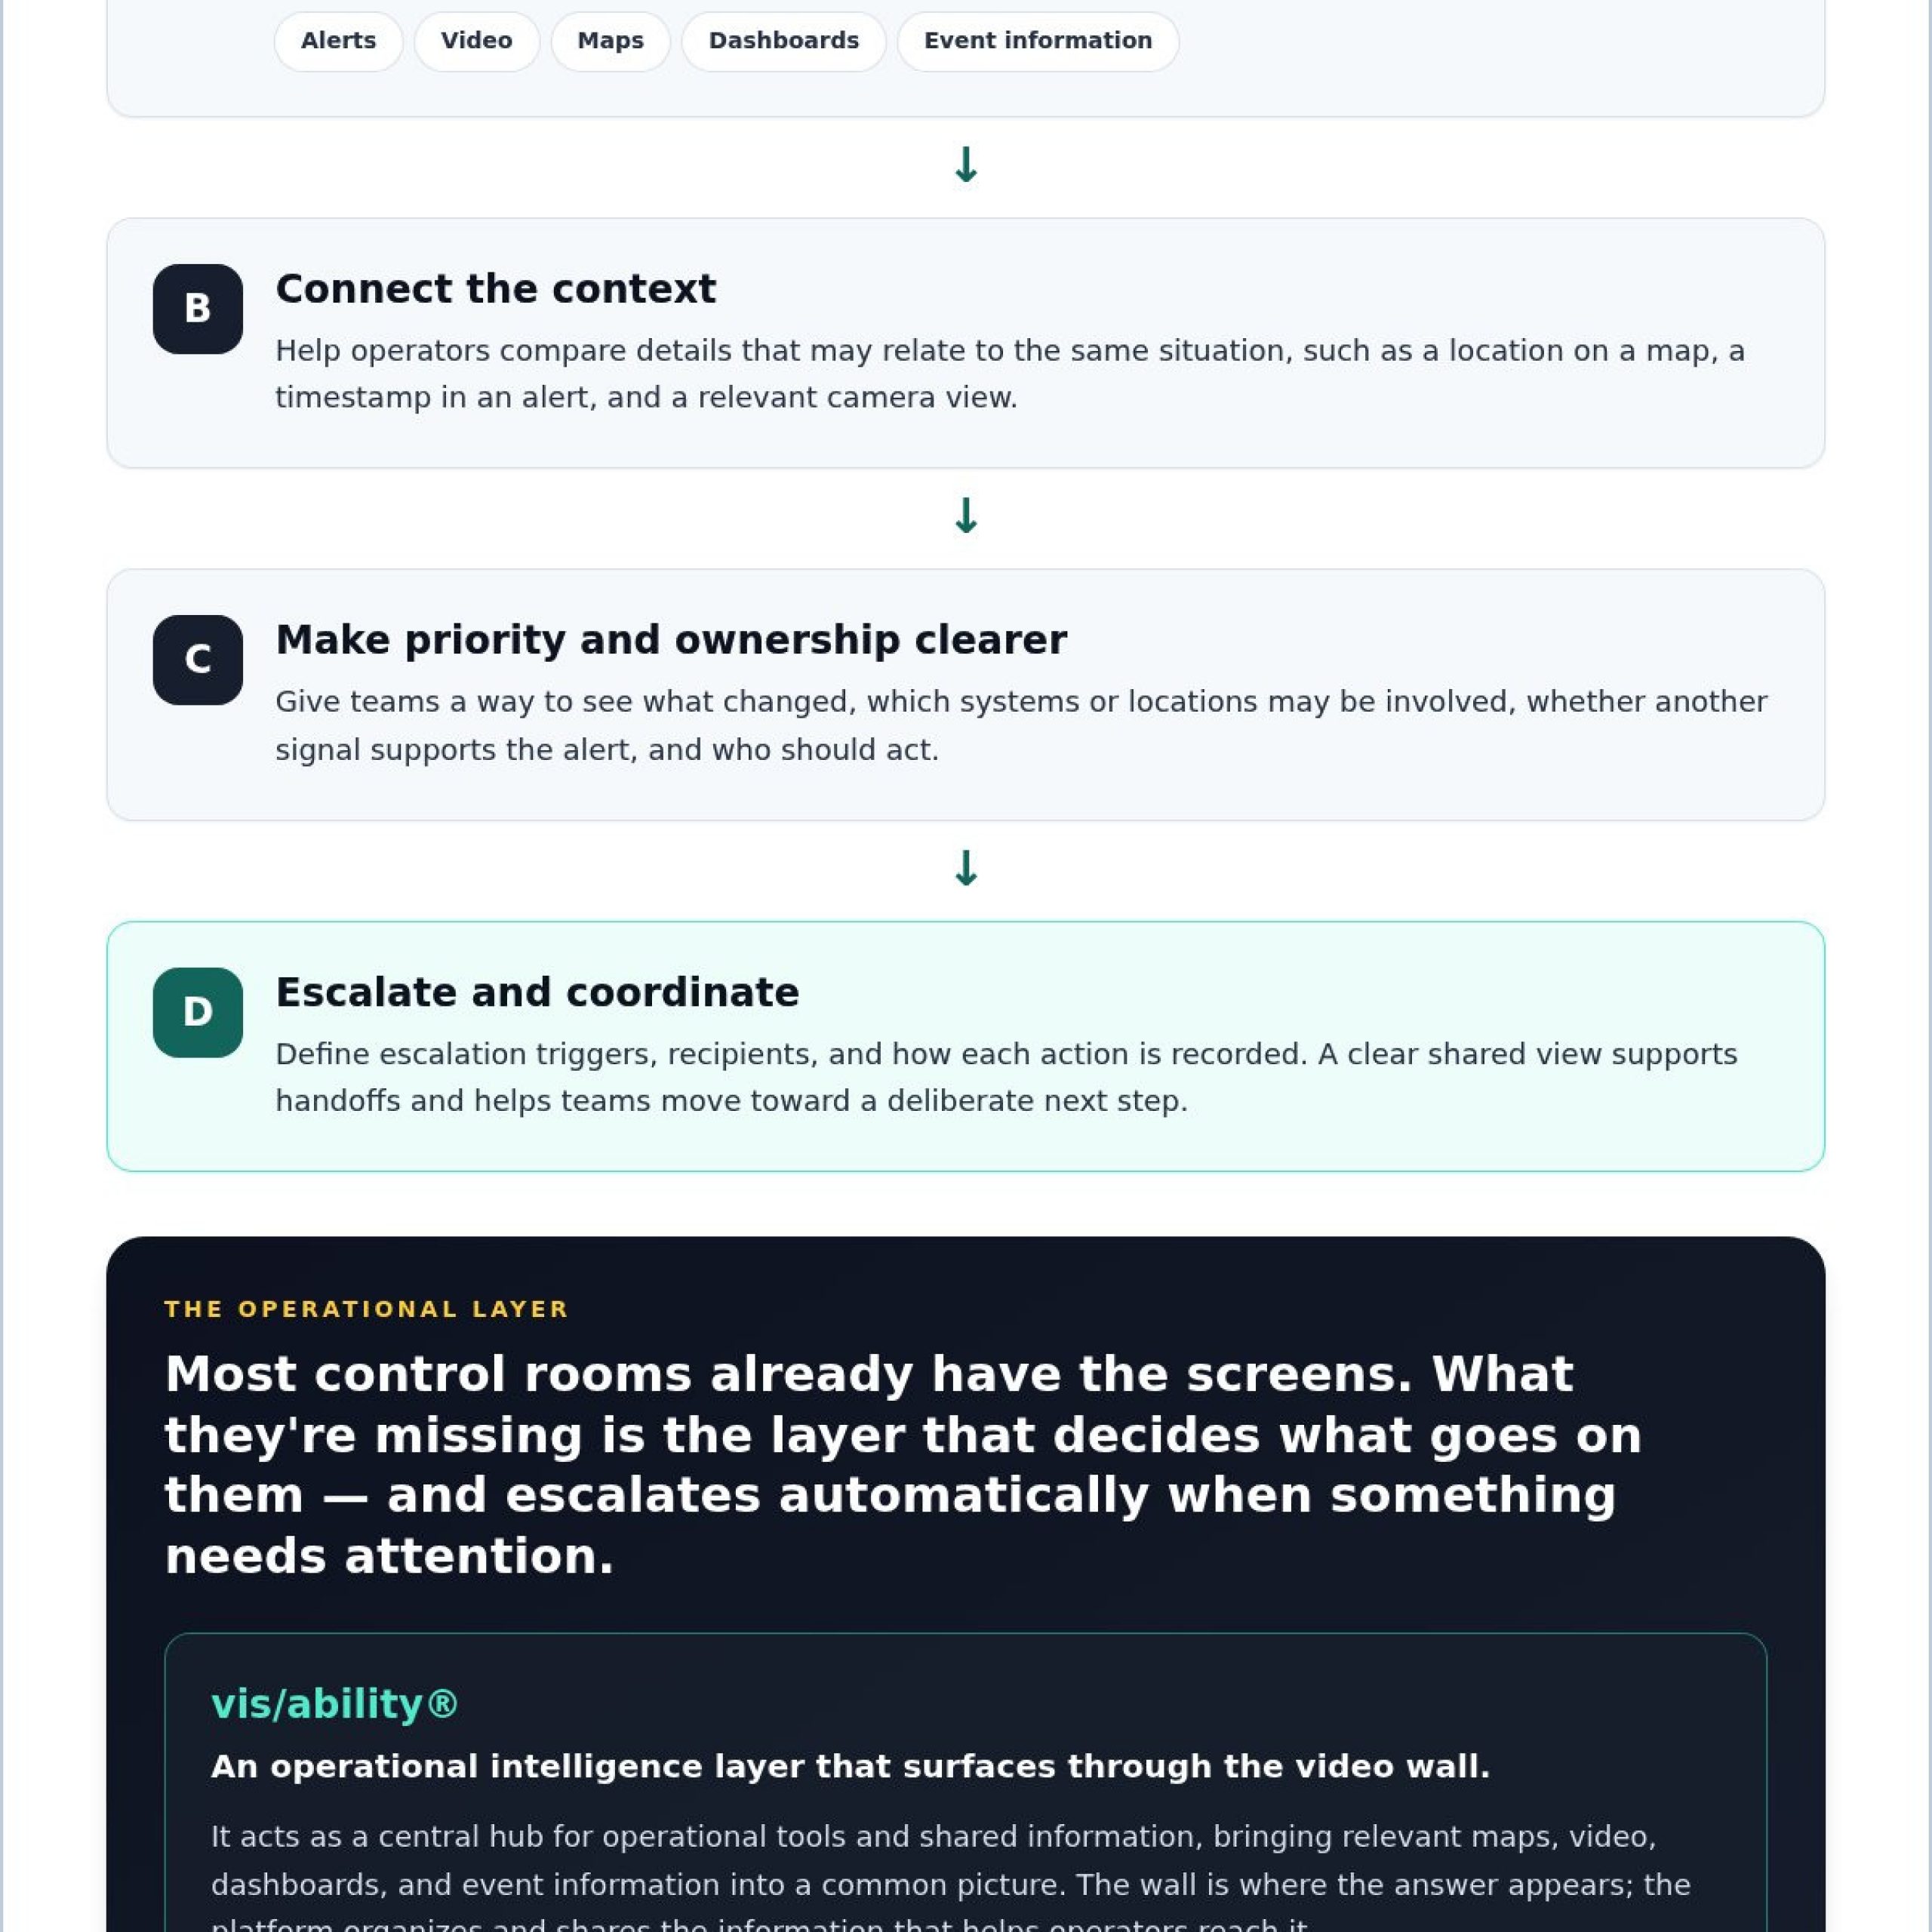
Adding dashboards can expose more data, but visibility alone doesn’t establish priority. Operators still need event context: what changed, which systems or locations may be involved, whether another signal supports the alert, and who should act. Without that context, additional panels can increase attention switching without resolving the central decision.
Visual clutter also complicates handoffs. An operator may point colleagues toward an alert without showing its relationship to other activity, or a team may assume another group is already handling it. A useful workflow makes ownership and escalation paths explicit. To evaluate automatic escalation, define the triggering conditions, recipients, and how each action is recorded. The platform should support the organization’s process, not substitute for it.
When assessing security operations center visualization software, ask whether it helps operators prioritize relevant information and coordinate around it. More feeds matter only when people can interpret them together, understand responsibility, and move from a signal to a deliberate next step.
What Security Visualization Software Does, and Where Predictive Analytics Fits
Once teams identify the gaps between systems, the next question is where a shared answer should appear. A video wall can provide that shared view, but its value depends on the operational layer that directs relevant information to it.
Most control rooms already have the screens. What they’re missing is the layer that decides what goes on them and escalates automatically when something needs attention.
Activu’s vis/ability® is an operational intelligence layer that surfaces through the video wall. It brings information from operational tools into a shared picture, including real-time maps, video feeds, dashboards, and event information. Teams can use that picture to understand current conditions and coordinate their next steps. The wall is where the answer appears; the platform organizes and shares the information that helps operators reach it.
Separate predictive analytics from event-driven visualization
Predictive analytics examines data to estimate what may happen in the future. Event-driven visualization serves a different purpose: it presents current feeds, maps, dashboards, and event information together so people can assess what is happening now. Displaying an alert beside related information doesn’t, by itself, forecast a future threat.
Keep those capabilities distinct when evaluating security operations center visualization software. Correlation can help an operator see that several signals may relate to one situation. Visual prioritization can make selected information more prominent. Neither action alone means the platform predicts what will happen next. Clear product language should identify whether a capability analyzes historical patterns, detects current conditions, routes alerts, or presents information for human interpretation.
Connect analytics, alerts, and the shared operating picture
Security tools remain responsible for the functions they already perform, such as collecting data or detecting events. For instance, intelligent surveillance deployments from providers like Digital-Vision.AI handle video monitoring and automated event detection on the front lines. An operational visualization layer brings information from those sources into a common view for the stakeholders who need shared context. That can include operators in a command center and colleagues working from other rooms or mobile devices. The aim is to help people work from relevant, current information, not to replace the systems that generate it.
A detection tool identifies a signal; an operational visualization layer helps people see that signal in context and coordinate around it. Use this distinction to assess product claims: identify which system detects, which workflow routes or escalates, and which layer presents the operational picture. These are connected roles, not interchangeable labels.
For a closer look at how vis/ability operational visualization brings data sources into a shared view, consider how the platform fits your team’s decision and coordination workflows. Separating these roles keeps predictive claims grounded while giving operators a clearer basis for action.
How to Compare SOC Visualization Software with Predictive Security Dashboards
Compare platforms by the work each capability performs in an incident workflow. A predictive security dashboard may analyze data to estimate future events. A visualization layer organizes operational information for people responding to current conditions. Some systems may support both, but product labels alone don’t establish what the software actually does.
Use these distinctions to assess where information originates, how it reaches operators, and which decisions the platform supports:
| Capability | Operational role | What to evaluate |
|---|---|---|
| Data analytics | Examines data to identify patterns or estimate possible future events. | Which data it analyzes, what output it produces, and whether claims describe analysis or prediction. |
| Alerting | Signals that a tool or process has detected a condition. | Which system generates the alert, how it reaches operators, and what context accompanies it. |
| Visualization | Presents feeds, maps, dashboards, and event information for operator review. | Whether relevant sources can be viewed together and organized for the operational task. |
| Escalation | Routes an alert or event according to a defined workflow. | Whether escalation steps, recipients, and triggers are clear and configurable for the process. |
| Collaboration | Helps stakeholders share information and coordinate decisions. | Whether teams can access the shared picture across rooms, workstations, and mobile devices. |
Evaluate feeds, event context, and escalation control
Test a realistic scenario, such as an alert that needs a location view, relevant video, and an operational dashboard for context. Check whether the platform can present these sources together and whether operators can control what appears, where it appears, and who can access it. Confirm how event management and automatic escalation fit the defined workflow. Displaying related information is not the same as predicting a threat.
Compare collaboration, flexibility, and infrastructure fit
Assess how a shared view reaches people outside the primary control room, including colleagues at workstations and mobile users. Then map the platform against existing displays, networks, and data sources. A new operational layer doesn’t automatically mean replacing security systems or displays. Activu’s software-first approach runs on common off-the-shelf hardware, requires no proprietary AV cabling, and can replace traditional video-wall controllers.
For each capability, ask what the operator can do during a defined workflow. Can the team bring current information into a shared view? Can participants in another room or on mobile see the relevant content? Does escalation follow an established process, or does a product description rely on broad terms such as “intelligent” or “predictive”? These questions help separate documented functions from interpretation or marketing language.
When evaluating security operations center visualization software, determine whether the system provides analytics, detects events, routes alerts, visualizes information, or supports collaboration. Activu’s vis/ability platform serves as the unifying operational layer for bringing existing tools and information into a shared picture, without requiring the underlying systems to be replaced.
A Practical Evaluation Process for Security Operations Center Visualization Software
Evaluate a platform against the decisions your team must make, not just its interface. Start with the workflow: what operators need to recognize, who must coordinate, and how information should reach them. Map the current environment before reviewing screens or assuming existing displays or security systems need replacement.
Map the SOC workflow before reviewing software
Document the people, sources, alert paths, and operating spaces involved in a typical incident. Include the teams monitoring each source and the points where information passes between them. Operational environments differ, so a SOC workflow may benefit from comparison with the distinct needs of SOC, NOC, and GSOC control rooms.
- Define the decisions. Identify what operators must decide during an event, such as whether to investigate, notify another team, or escalate through an established process. Record what information supports each decision.
- Inventory sources and feeds. List relevant security and operational data sources, including alerts, video, maps, dashboards, and case information. Note which teams use each source and where operators switch tools to see related details.
- Trace alert and escalation paths. Record how an alert moves from its source to the people responsible for reviewing and acting on it. Identify unclear ownership, manual handoffs, and steps that depend on someone relaying context.
- Map roles, rooms, and access needs. Identify who needs the shared operating picture in the command center, conference or huddle rooms, remote locations, and on mobile devices. Clarify what information each role needs to see and share.
- Review the platform against scenarios. Walk through representative security events from initial signal to coordinated decision. Assess whether relevant content becomes visible, authorized users can access it, escalation follows the defined workflow, and remote participants can contribute.
Validate the operating picture with realistic scenarios
Use scenarios that reflect actual procedures, not a generic product demonstration. For each one, observe whether operators can bring relevant information together, establish who owns the next action, and share context with stakeholders in other rooms or on mobile devices. Include incident-management connections in the walkthrough, noting how event details relate to existing records and coordination steps.
Keep the assessment centered on operational fit. A visualization layer can work with existing data sources and displays, so evaluation shouldn’t assume a wholesale replacement of security systems, furniture, or room infrastructure. Record gaps as workflow findings: missing context, unclear access, an unsupported handoff, or a coordination need that the current process leaves manual.
This process gives teams a grounded basis for comparing security operations center visualization software. Activu’s vis/ability platform can bring operational sources into a shared picture across the workflows your team needs to coordinate.
How Activu vis/ability® Supports a Unified Security Operations Picture
The evaluation criteria point to a practical need: bring operational tools into a shared picture while allowing existing systems to continue their roles in detection, analysis, and incident records. Activu vis/ability® serves as the central hub for those tools, helping teams organize and share relevant information across their operation.
The video wall is one place the answer appears through vis/ability®. Shared content can also reach workstations and mobile users, supporting teams in command centers, remote locations, conference rooms, breakout rooms, and huddle rooms. Stakeholders can work from a shared view across these settings.
Bring operational information into a shared view
vis/ability® brings together real-time maps, video feeds, dashboards, and event information. Event management and remote collaboration support coordinated work, while drag-and-drop content placement lets operators arrange information for the task at hand. The software also provides video-controller functionality, and mobile video streaming extends access beyond the control room.
vis/ability® supports Zoom meetings, a ServiceNow incident dashboard, and Active Shooter Recognition via Omnilert integration. These features connect operational information and collaboration workflows. They don’t make vis/ability® a predictive analytics tool: detection sources identify conditions, while the shared view helps stakeholders review information together.
Review the vis/ability® software platform in relation to your data sources, event workflows, and user roles. This clarifies how the platform can support the people who need to access and coordinate around operational information.
Support the platform beyond the initial deployment
Activcare provides remote monitoring and support for control-room technology stacks. vis/ability® Academy offers on-demand training for command-center operators. Together, these services support ongoing platform operations and operator readiness, while remaining distinct from the software’s visualization and event-management capabilities.
Activu was founded in 1983. More than 1,300 control rooms rely on Activu technology, and the company has implemented over 1,000 control rooms and video walls worldwide. These facts provide context as teams assess the platform against their workflows, integration needs, and collaboration requirements.
Build a clearer path from operational information to coordinated decisions by bringing your security operations workflow to Activu.
Set a Clearer Course for Security Operations
Turn your evaluation findings into an operational plan. Identify which decisions need stronger shared context, where teams need access to the same information, and how alerts should move through established workflows. Then assess security operations center visualization software against those priorities using scenarios that reflect how your people coordinate.
Activu’s vis/ability® platform is ISO 27001 certified and Vis/ability certified in the ServiceNow Store. The platform is 100% developed and maintained in the USA. These details support a practical discussion about how the software fits your security environment, existing tools, and operational requirements.
Bring your workflow priorities and coordination needs to Activu. Discuss how vis/ability® can support your security operations and take a confident next step toward clearer decisions across your team.
Frequently Asked Questions
Can security operations center visualization software predict cyberattacks?
A visualization layer alone shouldn’t be treated as predicting cyberattacks. Before relying on a prediction claim, identify which connected tool produces it, what output it provides, and how analysts should interpret that output. In a review, distinguish a forecast from an active alert or an operator’s assessment. This makes the origin and meaning of each signal clear before it informs a security decision.
Does a SOC visualization platform replace SIEM software?
No, replacement shouldn’t be assumed. Decide which system remains the source of record for security events and investigations, and document how analysts move between that system and the shared operating picture. Check whether operators can return to the originating record, maintain the existing investigation process, and understand which tool owns each step. The division of work depends on the organization’s architecture and workflows.
Does adopting SOC visualization software require replacing existing video walls?
No. Adopting the software doesn’t inherently require replacing existing displays. Use the current environment as the baseline for evaluation: identify the surfaces teams use, the information each needs, and any operational dependencies. Then test whether a proposed workflow can use those surfaces as intended. This keeps the project focused on operational requirements instead of assuming a display replacement is necessary.
What information can a SOC visualization platform bring into a shared operating picture?
Activu’s vis/ability® supports real-time maps, video feeds, dashboards, and event information, as well as Zoom meetings, a ServiceNow incident dashboard, and Active Shooter Recognition via Omnilert integration. To evaluate a workflow, trace an event from its source and note its time, location, and responsible team. That exercise helps operators interpret the assembled view while keeping each source’s role clear.
How can remote SOC staff collaborate around live information?
Remote collaboration can extend a shared operational view beyond the primary control room. vis/ability® supports content sharing to displays, workstations, and mobile devices, along with mobile video streaming and Zoom meetings. Identify which participants need the same view during a coordination meeting and what information each role needs. This helps teams define practical access needs without assuming every user requires identical content.
What does COTS mean for SOC visualization software?
COTS means common off-the-shelf hardware. In a system diagram, distinguish that computing hardware from the visualization software, connected security tools, and surfaces operators use to view information. This makes it easier to understand each component and avoid confusing a platform’s software capabilities with the function of its displays or data sources. Activu’s software-first vis/ability® platform runs on COTS hardware.