What if the very dashboards designed to protect your organization are actually the primary cause of your team’s delayed response times? A 2023 industry analysis found that 60% of security analysts feel overwhelmed by alert volume, which often leads to a 25% miss rate for critical threats. You already understand the danger of fragmented data silos and the cognitive fatigue they cause; these are the core control room situational awareness problems that leave infrastructure vulnerable. Implementing security operations center dashboard best practices is no longer optional when information is trapped in disconnected tools and your team loses the vital seconds required for effective incident containment.
Most control rooms already have the screens. What they’re missing is the layer that decides what goes on them, and escalates automatically when something needs attention. This article provides a checklist to help you transition from passive monitoring to a unified, event-driven operating picture. We’ll show you how to establish vis/ability, an operational intelligence layer that surfaces through the video wall to provide clarity exactly when stakes are highest. You’ll learn how to master the architectural standards required to automate threat escalation and ensure seamless collaboration for your entire distributed operation.
Key Takeaways
- Eliminate operational blind spots by bridging the visualization gap between fragmented data silos and mission-critical decision-making.
- Apply security operations center dashboard best practices to optimize visual hierarchy, ensuring clarity across individual consoles and large-scale video walls.
- Move beyond partial solutions like single-vendor stacks to establish a central vis/ability hub that unifies all disparate security streams into one cohesive operating picture.
- Master automated escalation protocols that transform your screens into an event-driven intelligence layer, surfacing the right information the moment a threat is detected.
- Maintain absolute situational awareness across distributed environments, extending visibility from the main command center to remote teams and mobile devices.
The Visualization Gap: Why Traditional SOC Dashboards Fail
Most control rooms already have the screens. What they’re missing is the layer that decides what goes on them, and escalates automatically when something needs attention. This layer is vis/ability. It functions as an operational intelligence layer that bridges the gap between raw data and decisive action. In mission-critical environments, technology must support human judgment rather than overwhelm it. When a crisis unfolds, the human element requires a clear, filtered view to maintain control and technical reliability.
The Problem of Fragmented Security Silos
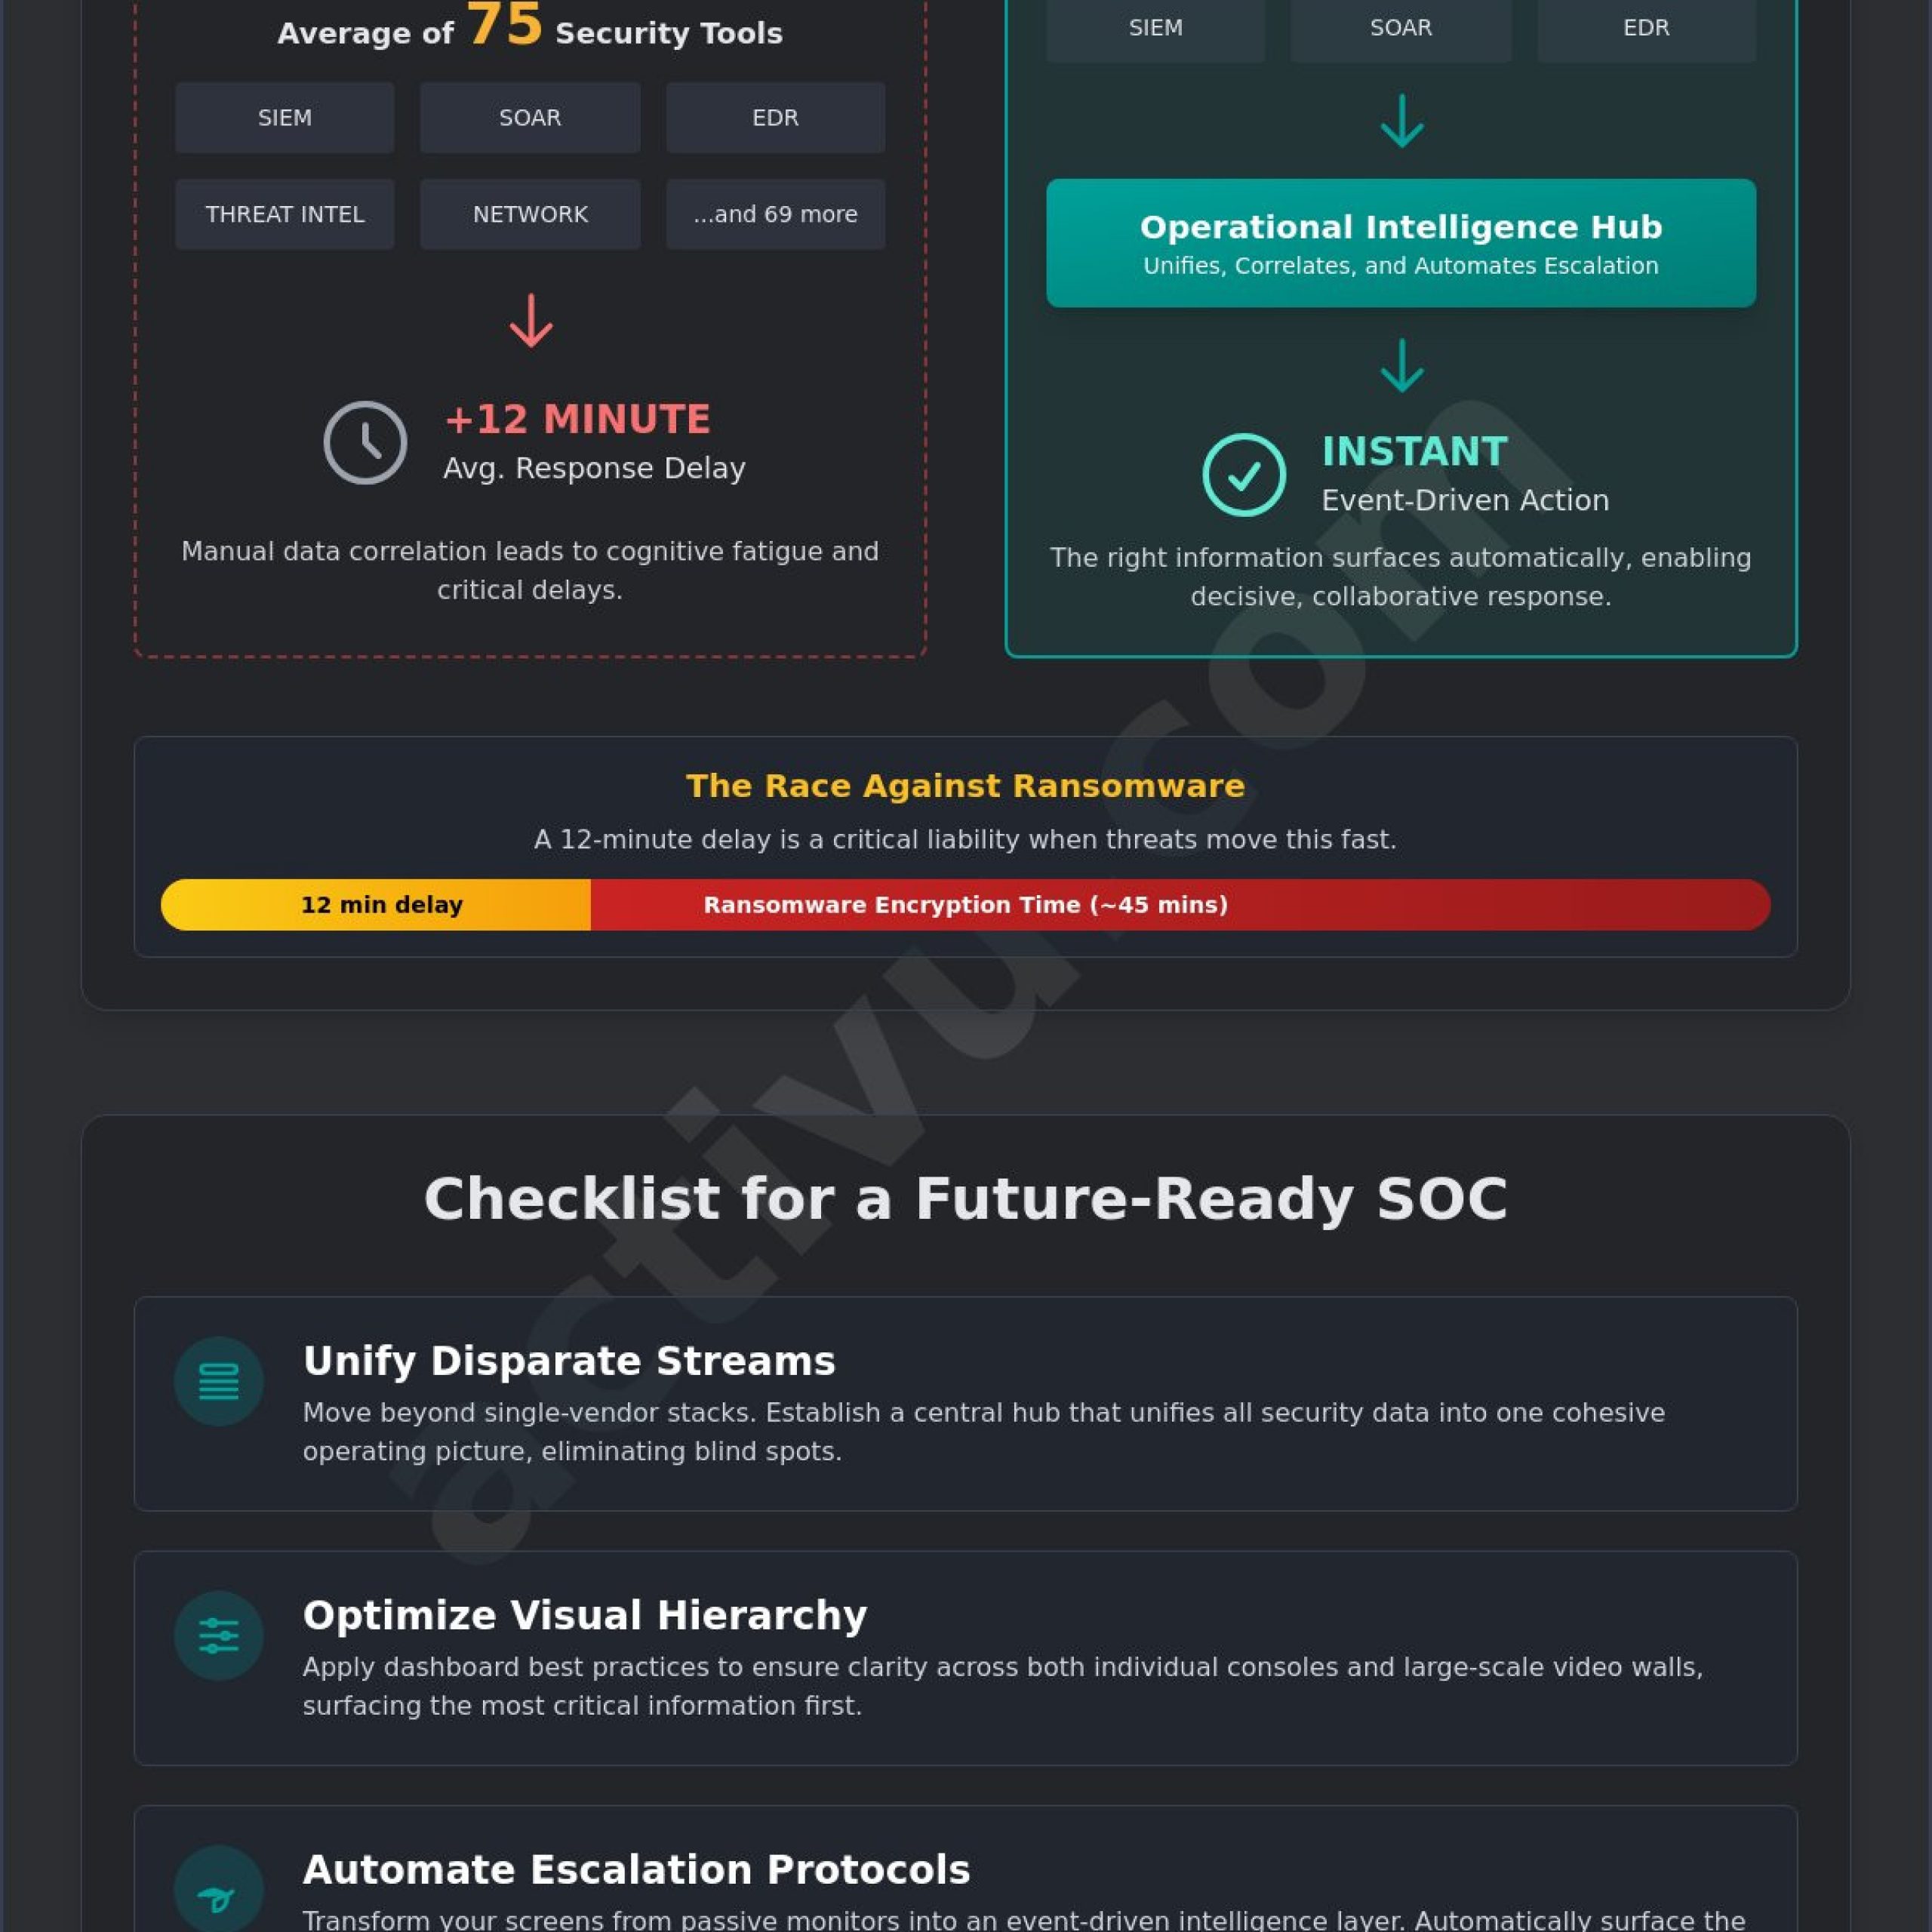
Disparate tools like SIEM, SOAR, and EDR provide deep technical telemetry but often lack a unified context. When a breach occurs, analysts suffer from high cognitive loads as they perform context switching between multiple platforms. A 2024 industry report indicates that the swivel-chair approach, manually correlating data across different monitors, increases response times by an average of 12 minutes. This delay is a severe liability in 2026. Effective security operations center dashboard best practices dictate that these tools must flow into a single, cohesive hub. While some organizations rely on standalone monitoring software, these are only partial solutions that require a unifying layer to be truly useful for the entire team.
The Critical Need for Automatic Escalation
Manual monitoring is no longer sufficient for high-velocity threat landscapes. Ransomware can now encrypt a network in under 45 minutes, making human reaction time the most critical variable. Event-driven visualization solves alert fatigue by surfacing only what matters when a specific threshold is met. Within this framework, situational awareness is the ability to perceive, comprehend, and project threat impacts across the entire operational environment.
- Perception: Recognizing a data anomaly across fragmented feeds.
- Comprehension: Understanding how that anomaly affects critical infrastructure.
- Projection: Predicting the path of the threat to mitigate future damage.
By implementing security operations center dashboard best practices, organizations ensure their video wall isn’t just a collection of static pixels. It becomes the place where the answer appears. When an incident triggers a predefined rule, vis/ability automatically pushes the relevant data to the forefront, allowing the team to act with absolute certainty.
Strategic Architecture: SOC Dashboard Design Best Practices
A Security Operations Center (SOC) dashboard is more than a display of metrics; it’s a tool for rapid decision-making under pressure. Effective security operations center dashboard best practices dictate that every visual element must align with the mission of the room. Many organizations struggle with fragmented systems and siloed data feeds that fail to communicate with one another. This fragmentation creates a significant gap in situational awareness, leaving analysts to manually correlate events while threats escalate. Most control rooms already have the screens. What they’re missing is the layer that decides what goes on them, and escalates automatically when something needs attention.
Designers must apply the “Three-Foot vs. Ten-Foot” rule to manage how information is consumed. The three-foot view on an analyst’s desktop console provides the granular detail needed for deep-dive forensics. In contrast, the ten-foot view on the central video wall must prioritize high-contrast, bold visuals that communicate status at a glance from across the room. Standardized color theory and iconography are essential to this strategy. Using red exclusively for critical incidents and neutral tones for steady-state operations reduces the cognitive effort required to identify a crisis. When visuals are standardized, the team moves from data interpretation to decisive action faster.
Establishing Information Hierarchy
Prioritizing high-fidelity alerts over background noise is the cornerstone of a functional central view. Analysts shouldn’t have to hunt for a breach notification amidst routine system updates. According to CISA’s SOCaaS guidelines, maintaining clear visibility into incident status and service health is a requirement for operational maturity. Integrating geospatial data further clarifies the mission by showing the physical impact of digital threats. For instance, mapping a network outage to a specific regional facility provides immediate context that a text-based alert cannot. A robust layout should include:
- Real-time incident status categorized by severity.
- Network health and critical infrastructure bandwidth.
- Live threat intelligence feeds correlated with internal telemetry.
Optimizing for Operator Cognitive Load
High-stress environments often lead to “tunnel vision,” where an operator becomes so focused on a single task that they miss critical changes in the broader environment. This is a primary reason why operators miss incidents video wall alerts during peak activity. To prevent this, the common operating picture must remain lean. Cluttering the screen with non-essential metrics increases fatigue and slows response times.
The natural integration of vis/ability solves this by acting as an operational intelligence layer. Instead of a static display, this technology manages content density automatically, surfacing only the most relevant data to the video wall when specific thresholds are breached. This automation ensures that the team stays focused on what matters most without being overwhelmed by data noise. To see how these design principles function in high-stakes environments, explore our solutions for modern SOC and GSOC environments.
Integration Checklist: Unifying Disparate Data Streams
Security Operations Centers often struggle with a fragmented landscape where operators must navigate 12 to 15 different applications to manage a single incident. This fragmentation creates a significant gap in situational awareness, leading to delayed response times and overlooked threats. Achieving security operations center dashboard best practices requires moving past the “swivel-chair” approach. The fallacy of the all-in-one tool suggests that a single-vendor stack can solve every problem. In reality, these closed ecosystems often create silos that prevent the ingestion of critical third-party data. Tools like Axon provide valuable evidence management, yet they offer only a fraction of the necessary context during an active crisis. They are partial solutions that require a central hub to become truly actionable.
Most control rooms already have the screens. What they’re missing is the layer that decides what goes on them, and escalates automatically when something needs attention. Technical reliability is the bedrock of this environment. In a 2023 analysis of mission-critical control rooms, 68 percent of operators identified data latency as a primary cause of decision-making friction. A robust dashboard must unify real-time video, telemetry, and threat feeds into a single pane of glass without compromising system stability. When data flows seamlessly from disparate sources, the team moves from a reactive state to a proactive posture.
Beyond SIEM and SOAR
Standard SIEM and SOAR tools are designed for digital log aggregation, but they frequently ignore the physical environment. To build a resilient security view, you must pull in non-traditional data such as physical security sensors, badge readers, and facility power status. Utilizing Commercial Off-The-Shelf (COTS) integration ensures your center remains flexible and can scale as new technologies emerge. Adhering to established mission critical operations standards provides the necessary framework for maintaining visibility during high-stress events. This integration strategy ensures that security operations center dashboard best practices are met by providing a holistic view of both cyber and physical assets.
The Role of the Common Operating Picture (COP)
A Common Operating Picture ensures every team member sees the same reality at the same time. Managing 20 or more concurrent data feeds in a busy dispatch or security center is impossible without a sophisticated filtering layer. This is where vis/ability becomes the essential bridge. We define vis/ability as an operational intelligence layer that surfaces through the video wall. It solves the common problem of why operators miss incidents on the video wall by highlighting only the anomalies that require immediate human judgment. By transforming raw data into a shared visual reality, vis/ability empowers the entire team to act with absolute certainty and precision.
Automated Escalation: Moving from Reactive to Proactive
Security operations centers often struggle with a critical gap between detection and action. While modern SIEMs and firewalls generate thousands of alerts, these signals frequently remain trapped in individual silos or buried in an operator’s workstation. This fragmentation is one of the primary reasons why operators miss incidents on the video wall. When a high-priority breach occurs, every second spent manually “pushing” data to the main display is a second lost to the adversary. Transitioning to a proactive posture requires more than just better sensors; it requires vis/ability, the operational intelligence layer that surfaces critical data at the exact moment it’s needed.
Most control rooms already have the screens. What they’re missing is the layer that decides what goes on them, and escalates automatically when something needs attention. This automated escalation transforms the video wall from a static monitoring tool into a dynamic incident management engine. By defining event-driven triggers, organizations can ensure that the display environment adapts instantly to the threat level. For example, a 25% spike in failed login attempts or a confirmed malware beacon can trigger an immediate content switch, replacing routine monitoring feeds with relevant forensic data, floor plans, and real-time network maps.
Workflow Automation for Incident Response
Implementing security operations center dashboard best practices involves configuring triggers that remove human latency from the escalation process. Instead of an analyst manually identifying a critical event and then deciding what to share, the vis/ability platform identifies the context of the alert and populates the video wall with the necessary intelligence. This ensures the right data reaches the right person instantly. For remote executives or field supervisors, these same triggers can push mission-critical alerts to mobile devices, maintaining a unified operating picture regardless of location.
Measuring Success: Metrics that Matter
The effectiveness of automated escalation is measured through Mean Time to Detect (MTTD) and Mean Time to Respond (MTTR). In a manual environment, MTTR is often inflated by the time spent gathering data and briefing stakeholders. Automation can reduce the time spent on manual content switching by over 60 seconds per incident, a margin that often determines the difference between a contained event and a full-scale breach. This direct impact on Operational Continuity ensures that the organization remains resilient even during complex, high-velocity attacks.
To see how vis/ability can unify your fragmented data feeds into a proactive response hub, explore our SOC solutions.
Extending Visibility: Distributed Teams and Mobile Integration
The modern Security Operations Center (SOC) is no longer confined to a single physical room. Today’s high-stakes environments demand that situational awareness extends to remote operators, executive huddle spaces, and field personnel. When a crisis occurs, the gap between the primary command center and distributed specialists often leads to fragmented responses and delayed mitigation. Most control rooms already have the screens. What they’re missing is the layer that decides what goes on them and escalates automatically when something needs attention.
Fragmented systems and data silos prevent a unified response. While individual tools like Axon or various VMS platforms provide specific data, they often fail to provide the holistic view necessary for team-wide coordination. Establishing security operations center dashboard best practices involves ensuring that every stakeholder, regardless of their location, sees the same operational reality. This visibility ensures that the bridge between raw data and human judgment remains intact during critical events.
Visibility Beyond the Control Room
Critical incidents rarely stay within the confines of the SOC. When a threat escalates, decision-makers often move to conference rooms or breakout spaces to manage the response. If these rooms are not integrated into the central intelligence layer, leaders operate with outdated information. Effective integration strategies ensure that any screen in the organization can become an extension of the SOC. This capability allows remote specialists to contribute to the unified operating picture securely, maintaining the same level of detail as the main video wall.
Field situational awareness is equally vital. By utilizing vis/ability Mobile, operators on the ground receive real-time updates and visual data directly on their devices. A 2024 study of incident response teams found that organizations using mobile-integrated common operating pictures reduced their mean time to resolve (MTTR) by 22 percent. This seamless connection ensures that the answer to a problem appears exactly where it is needed, whether that is a 20-foot video wall or a handheld device.
Finalizing Your SOC Dashboard Strategy
Your strategy must address the fundamental gap between data collection and actionable intelligence. Many organizations rely on manual processes to update their displays, which leads to critical incidents being missed during high-traffic periods. The vis/ability solution acts as an operational intelligence layer that surfaces through your existing hardware, automating the flow of information based on real-time triggers.
To audit your current environment against 2026 standards, evaluate your system against this final checklist:
- Does the dashboard automatically escalate critical alerts without manual operator intervention?
- Can the unified operating picture be shared instantly with remote huddle rooms and mobile devices?
- Is the system capable of aggregating disparate data feeds into a single, cohesive view?
- Does the technology prioritize mission-critical information over routine background data?
Adopting these security operations center dashboard best practices ensures your team remains proactive rather than reactive. If your current setup leaves you searching for answers across multiple disconnected screens, it is time to evolve. Contact Activu for a custom control room assessment to bridge the gap in your operational visibility.
Achieve Absolute Clarity in Your Security Operations
Effective security operations center dashboard best practices require more than just mounting monitors. They demand a shift from reactive monitoring to proactive intelligence. Organizations often struggle with fragmented data streams that overwhelm operators, leading to missed incidents. By implementing a common operating picture, teams can unify disparate feeds into a single, actionable view. Activu has spent over 30 years refining mission critical environments for defense agencies, transportation hubs, and global utilities. Our vis/ability platform acts as an operational intelligence layer that surfaces through the video wall, ensuring only relevant data reaches the decision maker.
Most control rooms already have the screens. What they’re missing is the layer that decides what goes on them, and escalates automatically when something needs attention. This automated escalation transforms the video wall from a passive background into a dynamic tool. Whether you’re managing a global SOC or a local emergency operations center, the goal remains the same: total situational awareness. Don’t let critical alerts get lost in the noise of a static dashboard.
Take the next step toward operational excellence. Request a custom assessment of your SOC situational awareness needs to see how we can streamline your mission critical workflow. Your team deserves the confidence that comes from seeing exactly what matters when it matters most.
Frequently Asked Questions
What are the most critical elements to include on a SOC dashboard?
Critical elements include real-time threat intelligence feeds, active incident timelines, and system health indicators. Effective security operations center dashboard best practices require moving beyond static charts to dynamic visualizations that highlight anomalies in network traffic or user behavior. Most control rooms already have the screens. What they’re missing is the layer that decides what goes on them, and escalates automatically when something needs attention. This vis/ability layer ensures 100% of critical data reaches the right person at the moment of decision.
How can I reduce operator fatigue in a 24/7 security operations center?
You reduce operator fatigue by implementing automated filtering that only surfaces mission-critical alerts. In 24/7 environments, 60% of analysts report burnout from monitoring repetitive, non-actionable data, which is one of the most common control room situational awareness problems. Vis/ability addresses this by acting as an intelligent filter. It moves the focus from hunting for problems to responding to verified threats, creating a calm, focused atmosphere even during high-stakes events.
What is the difference between a SIEM interface and a Common Operating Picture?
A SIEM interface provides deep technical logs for analysts, while a Common Operating Picture provides a unified view for the entire command team. While 85% of SOCs use a SIEM, these tools often remain siloed, providing only a partial solution for organizational awareness. Vis/ability serves as the central hub, pulling SIEM data into EOC common operating picture solutions that include physical security and network status, giving everyone a single version of the truth.
How do I manage multiple data feeds without overwhelming my security team?
Managing multiple data feeds requires an operational intelligence layer that prioritizes information based on severity and relevance. Organizations often struggle with how to manage multiple data feeds dispatch center environments because they lack a unified platform to correlate disparate information. Vis/ability integrates these streams into a single source of intelligence. It ensures that 100% of relevant data is processed while noise is suppressed, allowing teams to maintain control without drowning in raw information.
Can I extend my SOC dashboard to mobile devices for remote incident response?
Yes, vis/ability extends the SOC dashboard to mobile devices, remote setups, and huddle rooms to ensure seamless incident response. When a critical threshold is met, the system pushes the relevant visual data to any authorized device instantly. This capability ensures that a field supervisor or a remote executive has the same situational awareness as an operator sitting at the main video wall, facilitating faster decision-making across the entire organization.
What is the best way to integrate physical security data into a cyber SOC dashboard?
The best way to integrate physical security data is through a platform that merges VMS feeds and access control logs with cyber telemetry. Relying on separate screens for physical and digital threats creates a dangerous gap in visibility that can lead to missed correlations. Vis/ability bridges these silos, presenting a holistic view that allows teams to see how a physical breach might correlate with a network intrusion, providing a level of intelligence that standalone tools like Axon cannot achieve on their own.
How does automatic escalation improve incident response times?
Automatic escalation improves response times by removing the manual steps between detection and action. Research from 2023 indicates that automated workflows can reduce mean time to respond by 40% compared to manual notification processes. Most control rooms already have the screens. What they’re missing is the layer that decides what goes on them, and escalates automatically when something needs attention, ensuring no critical event is ignored due to human oversight.
Why do operators often miss incidents on a standard video wall?
Operators miss incidents because static video walls often display “wallpaper” data that lacks context or visual cues. This is a primary reason why operators miss incidents video wall configurations often face in traditional centers. Vis/ability solves this by only surfacing data when a specific trigger occurs. The answer appears on the wall exactly when it’s needed, capturing the operator’s attention through dynamic change rather than forcing them to stare at constant, unchanging feeds.