
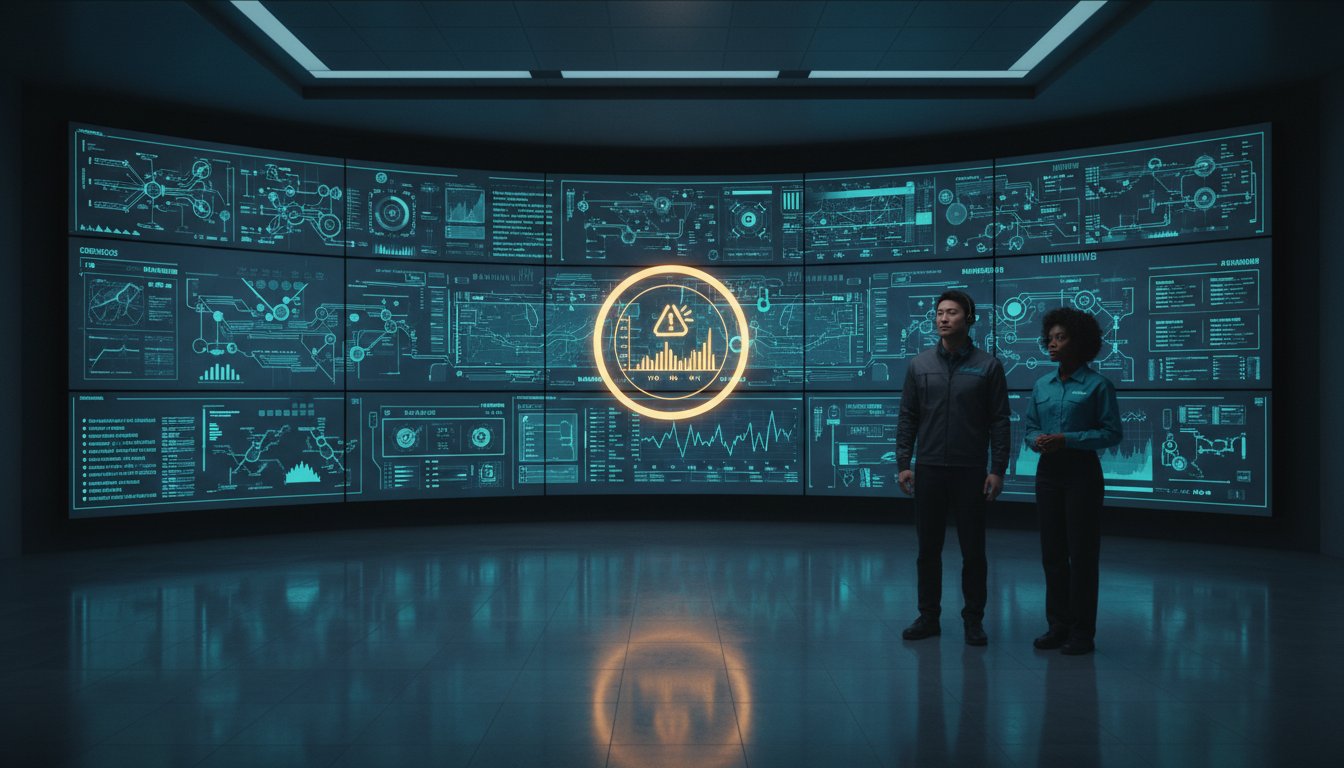
What if the 12 monitors at an operator’s desk are actually preventing them from seeing the one critical alert that matters most? In high-stakes environments, the gap between having raw data and achieving true intelligence is often measured in minutes of downtime. Most NOC teams struggle with fragmented systems and data silos that force manual intervention during every minor incident. This constant monitoring of static feeds leads to fatigue; a 2023 analysis of mission-critical environments found that 40 percent of critical alerts can be missed during peak traffic periods. This lack of automated intelligence makes effective network operations center visualization nearly impossible. Most control rooms already have the screens. What they’re missing is the layer that decides what goes on them, and escalates automatically when something needs attention.
Closing this gap requires vis/ability. We define vis/ability as the operational intelligence layer that surfaces through the video wall to provide clarity when stakes are highest. You’ll learn how to transform fragmented data into actionable situational awareness by implementing an event-driven visualization layer in your NOC. This article explores how to achieve a unified operating picture and reduce your mean time to resolution by automating visual escalation the moment thresholds are met.
Key Takeaways
- Identify the critical operational gap created by fragmented systems and data silos that prevent real-time situational awareness in high-stakes environments.
- Understand why most control rooms already have the screens but lack the intelligence layer required to decide what information is surfaced and when to escalate automatically.
- Transform your network operations center visualization from a collection of static dashboards into a proactive, event-driven environment that highlights mission-critical incidents.
- Learn to integrate disparate monitoring tools into a single unifying hub, ensuring that critical threshold events are never missed by operators.
- Future-proof your operations by transitioning from proprietary, hardware-locked systems to flexible, COTS-based solutions that enhance visibility across the entire enterprise.
The Critical Gap in Modern Network Operations Center Visualization
In high-stakes environments, the distance between raw data and a decisive response determines the outcome of a crisis. Most organizations face a persistent obstacle: fragmented systems and data silos that obscure the real-time health of their infrastructure. These silos force operators to manually correlate alerts from disconnected tools, creating dangerous blind spots during 24/7 operations. This lack of automatic escalation and unified context defines the modern operational gap. Before a video wall can be effective, an organization must address the underlying fragmentation that prevents a common operating picture.
Most control rooms already have the screens. What they’re missing is the layer that decides what goes on them, and escalates automatically when something needs attention. Effective network operations center visualization requires more than just high-resolution hardware. It demands a transition from monitoring every single data point to visualizing only what matters for mission-critical success. Without this intelligence layer, even the most expensive video wall remains a passive display rather than an active tool for situational awareness. The goal is to move beyond simple monitoring and toward a state of constant, actionable clarity.
Why Operators Miss Incidents on the Video Wall
Static dashboards in a Network operations center (NOC) often lead to cognitive overload. When a wall is filled with wall-to-wall data lacking context, the human brain struggles to identify anomalies. Research into control room human factors shows that operator performance can drop by 25% after just two hours of monitoring repetitive, non-dynamic data feeds. This is why operators miss incidents on the video wall; they’re looking at data, but they aren’t seeing information. The visualization gap is the space between data collection and human judgment.
The Limitations of Fragmented Monitoring Silos
Standalone tools like SolarWinds or Nagios provide essential telemetry, but they’re insufficient for total situational awareness. These platforms function as isolated silos, requiring operators to jump between screens to understand the impact of a single alert. During rapid-onset incidents, manual escalation processes fail because they rely on human speed to bridge the gap between tools. vis/ability acts as the central hub, pulling these disparate feeds into a single, cohesive view. It transforms fragmented monitoring into a proactive command environment where the right answer appears on the wall exactly when it’s needed. By integrating these tools into a network operations center visualization strategy, teams gain the ability to act with absolute certainty when the stakes are highest.
Beyond Static Dashboards: The Evolution of NOC Situational Awareness
Fragmented systems and data silos represent the primary obstacle to effective incident response. When network subject matter experts are forced to toggle between isolated monitoring tools, they lose the critical context needed to identify root causes. This gap in visibility leads to delayed decisions and increased downtime. True situational awareness requires an operational intelligence layer, known as vis/ability, that sits above these individual tools. Most control rooms already have the screens. What they’re missing is the layer that decides what goes on them, and escalates automatically when something needs attention. When this intelligence is applied, the video wall ceases to be a simple display and becomes the central place where the answer appears.
What is a Common Operating Picture (COP)?
A Common Operating Picture (COP) provides a single, authoritative source of truth for distributed teams. In a mission-critical NOC, a COP must integrate real-time telemetry, geospatial data, and incident logs into a unified view. This synchronization ensures that a remote stakeholder sees the exact same critical data as the lead operator on the floor, eliminating the discrepancies that often occur during high-pressure events. Effective network operations center visualization requires more than just high-resolution screens; it requires a platform that can synchronize these disparate feeds into a cohesive narrative. Organizations often utilize advanced data visualization techniques to help experts identify complex patterns that simple graphs miss. You can explore the technical requirements for these environments in our guide on What is a Common Operating Picture? to see how it stabilizes distributed operations.
The Role of Event-Driven Logic in Operations
The shift from “always-on” to “on-demand” visualization marks the next stage of NOC maturity. Simple alerts often contribute to alarm fatigue, where operators are overwhelmed by a sea of red icons that lack context. Event-driven situational awareness uses automated triggers to surface only the information that matters. When a specific threshold is met, vis/ability automatically populates the video wall with the relevant maps, camera feeds, and network topology. This reduces the cognitive load on front-line operators and ensures that the answer appears exactly when it’s needed. It’s the difference between a notification that a server is down and a complete visual briefing of the affected service chain. By focusing on network operations center visualization that reacts to real-world triggers, teams can achieve the 15 to 20 percent efficiency gains typical of high-performing analytical environments. To see how these principles apply to your specific environment, consider how our solutions support modern NOC and SOC operations.
Introducing vis/ability: The Intelligence Layer for NOC Visualization
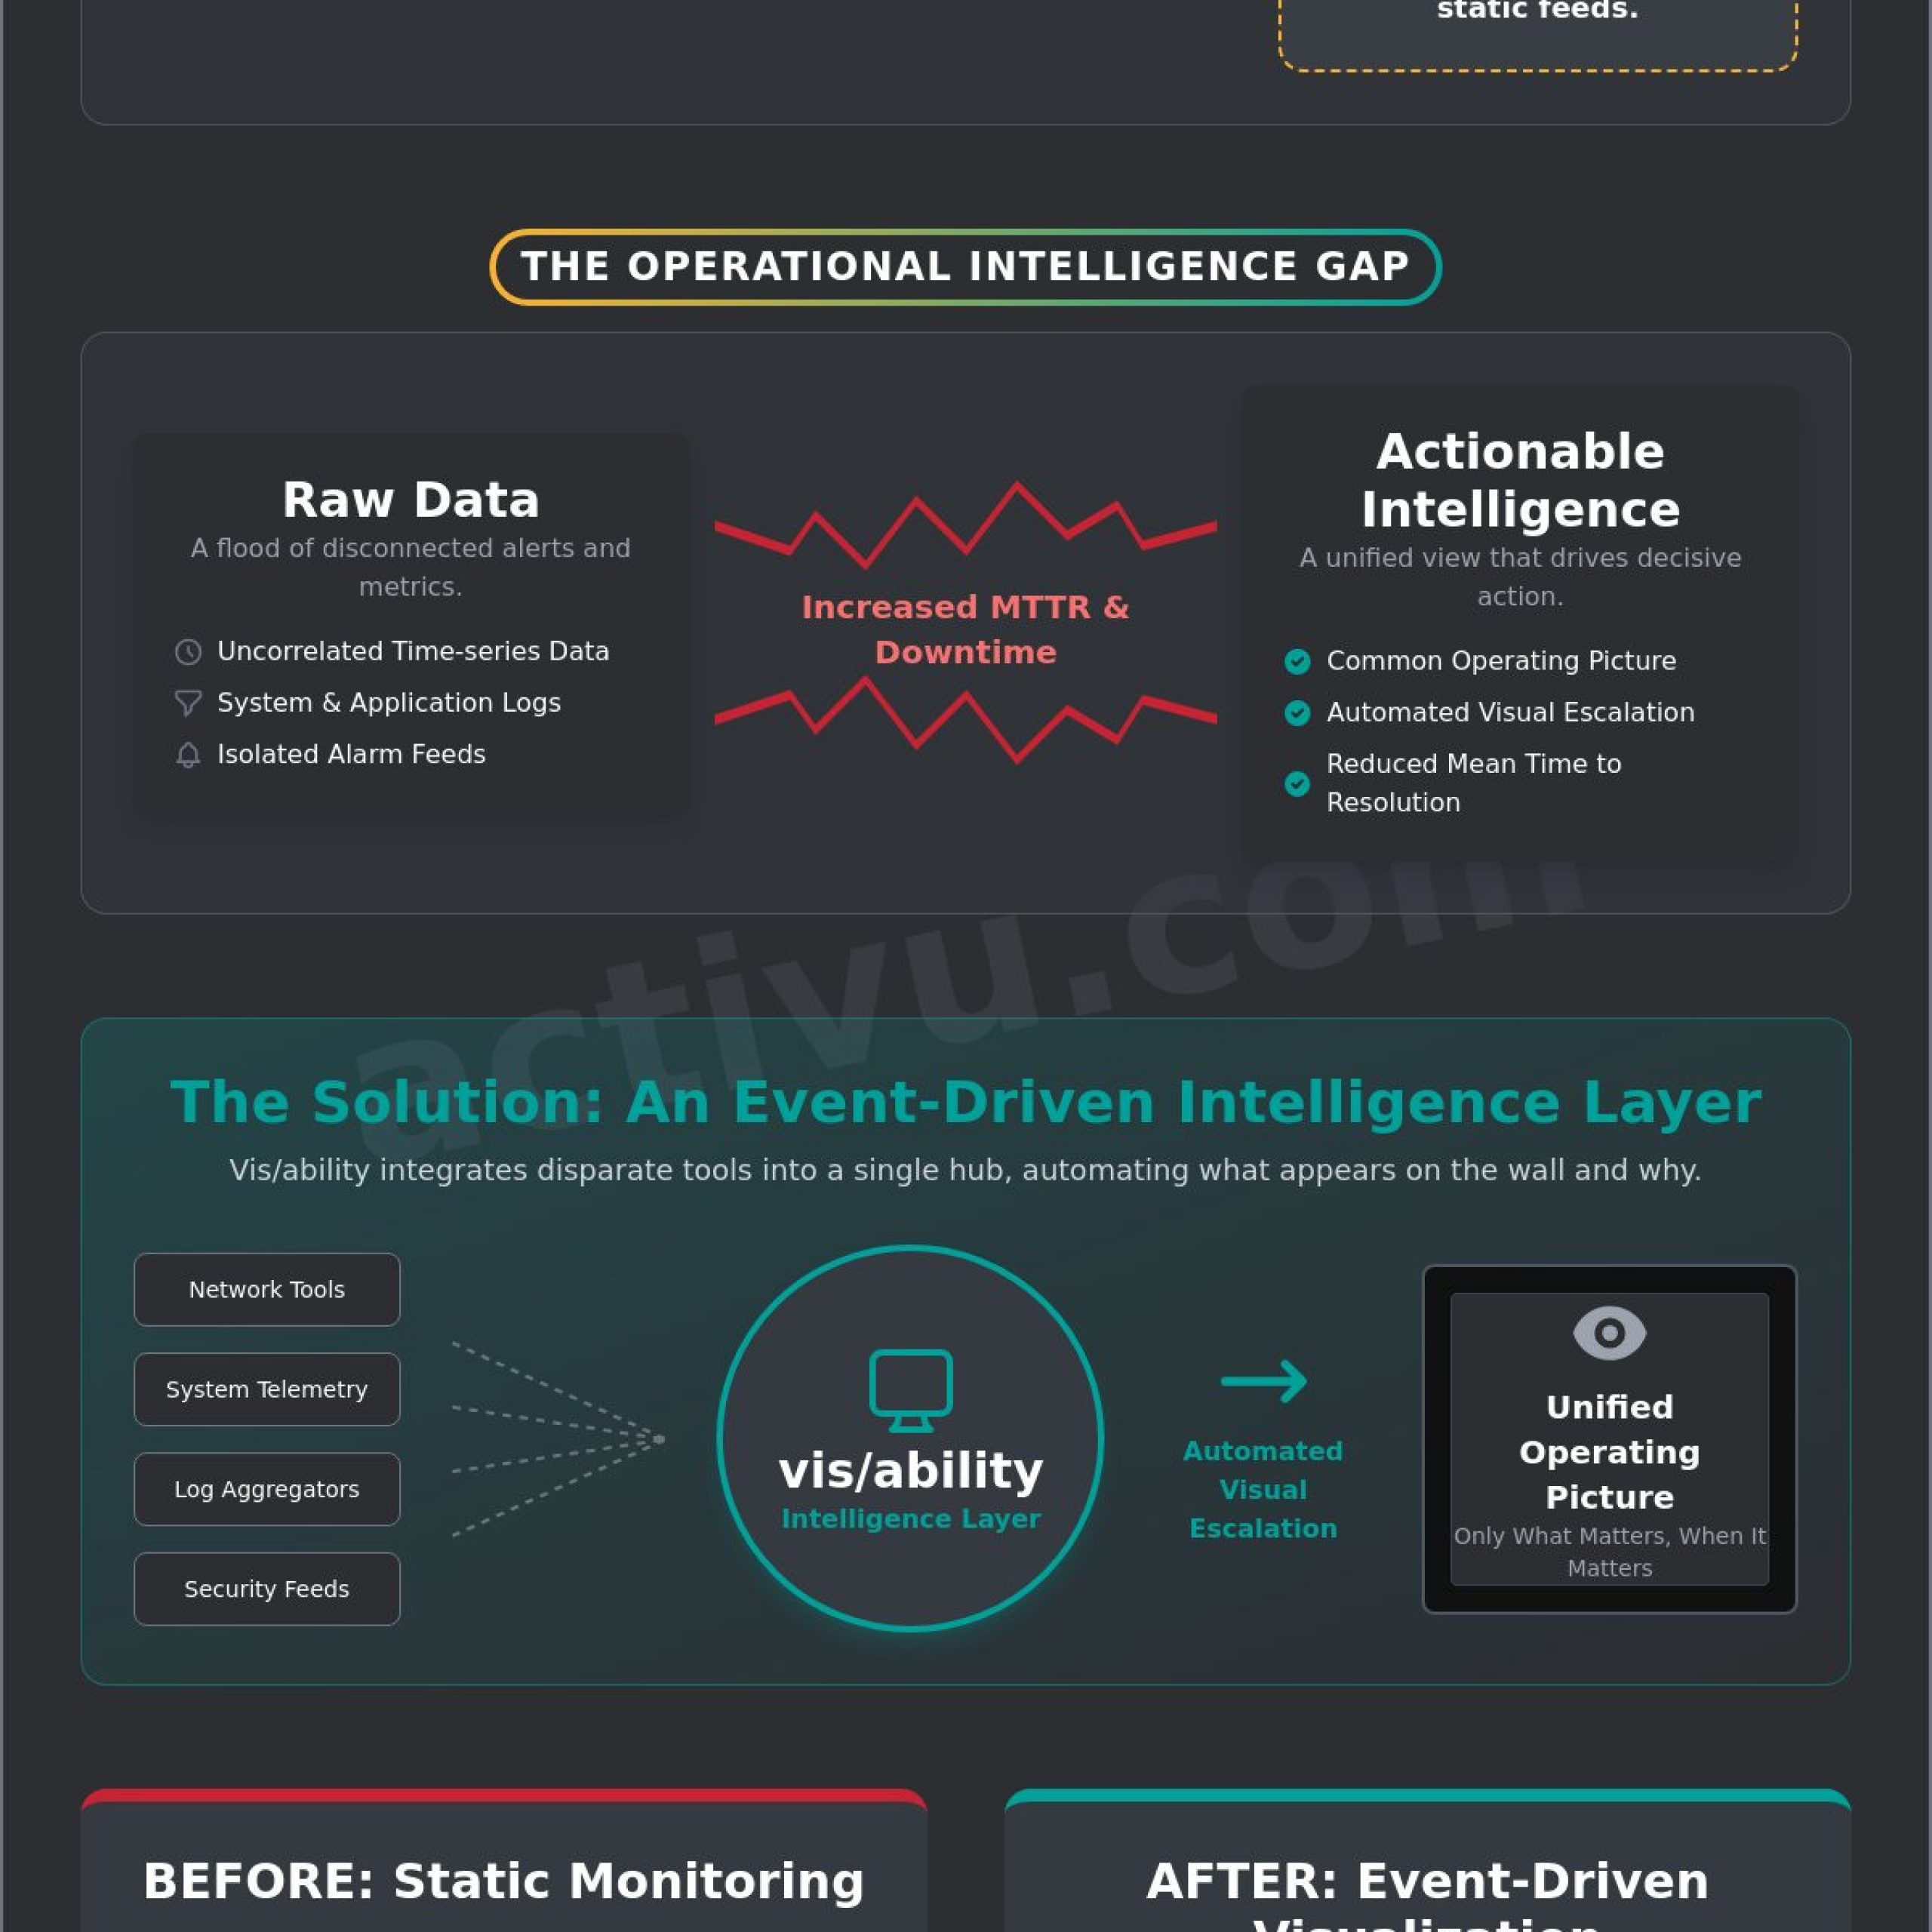
vis/ability functions as the operational intelligence layer that surfaces through the video wall, transforming passive display surfaces into active decision-support systems. It moves beyond simple pixel management to provide a software-defined architecture that filters and prioritizes information based on real-time urgency. This approach ensures that network operations center visualization remains focused on actionable insights rather than a confusing sea of static dashboards.
Most control rooms already have the screens. What they’re missing is the layer that decides what goes on them, and escalates automatically when something needs attention. Without this intelligence, even the most advanced hardware remains underutilized. vis/ability maximizes hardware ROI by directing the right data to the right screen at the right time, ensuring that million-dollar investments in display technology serve a clear operational purpose.
Unifying Siloed Systems into a Single Interface
Modern operations rely on a fragmented ecosystem of SIEM, SOAR, and geospatial tools. While these systems provide deep data, they often exist in isolation, forcing operators to toggle between tabs and workstations during a crisis. vis/ability acts as the central unifying hub for all operational data, integrating complex applications, video streams, and real-time telemetry into a cohesive view. This integration is the essential bridge between raw data and human judgment, allowing teams to see the full context of an event without manual intervention.
The need for structured data presentation is not new. Significant IEEE research on NOC visualization, specifically examining the AT&T Global Network Operations Center as early as 2000, highlights how critical it is to synthesize massive data streams for human operators. vis/ability modernizes this concept by making tools like Splunk or ServiceNow truly useful for the whole team. It ensures that critical alerts are not buried in an individual’s inbox but are instead projected where they can drive collective action.
Escalation and Automation: The Core of vis/ability
The platform eliminates the “search and rescue” phase of incident response. When a threshold breach occurs, such as a 15% spike in latency or a security perimeter violation, vis/ability automatically surfaces the relevant data onto the video wall and connected devices. This automated escalation removes the burden from the operator to manually find the “right” screen while a crisis is unfolding. It provides immediate situational awareness across the entire command center and remote huddle rooms simultaneously.
By defining specific triggers within the Activu vis/ability Platform, organizations can reduce their Mean Time to Knowledge (MTTK). The system does not just show data; it monitors the data for you. When an incident meets predefined criteria, the software assembles the necessary visual evidence and distributes it to stakeholders on mobile devices, workstations, and large-scale displays. This proactive posture ensures that the team stays ahead of the incident curve, maintaining control when stakes are highest.
How to Manage Multiple Data Feeds in an Operations Center
Operational teams often struggle with fragmented monitoring tools that create data silos. While software like Splunk, SolarWinds, or PRTG provides essential metrics, these systems don’t naturally communicate with one another. This fragmentation forces operators to toggle between tabs, leading to a dangerous lag in response time. Most control rooms already have the screens. What they’re missing is the layer that decides what goes on them, and escalates automatically when something needs attention. This is vis/ability, an operational intelligence layer that surfaces through the video wall to provide immediate clarity. By integrating these disparate feeds, network operations center visualization transforms from a simple display into a proactive decision support system.
To manage this complexity, you must first audit your current data sources and identify critical threshold events. A 2023 analysis of enterprise NOC environments found that operators manage an average of 15 different monitoring tools simultaneously. Managing this volume requires an integration layer that aggregates feeds into a unified operating picture. You can then configure event-driven triggers to automate screen layout changes. When a Tier 1 server fails or a security breach is detected, the system should instantly prioritize that data. This establishes a hierarchy of visual information based on incident severity, ensuring the most urgent data is always front and center.
Solving the Challenge of Data Overload
Data overload is a primary reason why operators miss incidents video wall alerts during high-tempo shifts. A 2022 study on cognitive load in command centers indicated that performance drops by 35% when operators face more than five simultaneous data streams. You can mitigate this by filtering noise and highlighting mission-critical alerts through dynamic layout management. This process ensures the screen environment evolves alongside the operational tempo. For organizations looking to refine these workflows, implementing specialized NOC and SOC Control Room Solutions provides the necessary framework to maintain focus during a crisis.
Collaborating Across Distributed Teams
True network operations center visualization isn’t limited to the physical control room. It must extend to mobile devices and remote workstations to be truly effective. This ensures a consistent view of the truth for field technicians and executives who aren’t on-site. When you’re looking for how to manage multiple data feeds dispatch center environments, the solution must include remote accessibility. For instance, if a utility provider faces a grid failure, the repair crew on their mobile devices should see the same intelligence layer as the dispatchers. This level of synchronization reduces the Mean Time to Repair (MTTR) by providing every stakeholder with the same actionable intelligence.
Ready to eliminate the gaps in your operational intelligence?
Contact our team to see how vis/ability can unify your data feeds.
Future-Proofing Your NOC Visualization for 2026
By 2026, the volume of telemetry data from edge devices and cloud infrastructure is projected to increase by 300 percent. This surge in data velocity renders traditional, static monitoring methods obsolete. Most control rooms already have the screens. What they’re missing is the layer that decides what goes on them, and escalates automatically when something needs attention. Effective network operations center visualization must evolve from a passive display into a proactive intelligence hub that prioritizes critical events over routine background noise.
Integrating Cybersecurity into the NOC Workflow
The boundary between network performance and security has dissolved. Modern threats often present as performance anomalies before they’re identified as malicious breaches. A Cybersecurity Common Operating Picture within the NOC allows teams to unify IT and SecOps during a coordinated threat response. A 2024 industry report indicates that siloed tools can delay incident response by up to 18 minutes. Vis/ability eliminates this gap by serving as an operational intelligence layer that surfaces through the video wall. When a DDoS attack or an unauthorized lateral movement occurs, the system identifies the shift in network behavior and automatically populates the relevant security dashboards and traffic maps for the entire team.
The Shift Toward COTS and Software-Defined Visualization
Proprietary, hardware-locked video wall processors create rigid environments that struggle to scale. Organizations are increasingly moving toward Commercial Off-the-Shelf (COTS) architectures to ensure long-term resilience. These software-defined layers provide the flexibility needed for evolving networks. Unlike closed systems that require specialized hardware components for every new input, a COTS approach allows for seamless integration with browser-based tools and virtualized data sources. Moving to this flexible architecture ensures that network operations center visualization remains agile. This shift prevents the common problem where operators miss incidents because their video wall is limited by physical port counts or outdated hardware codecs.
Predictive analytics will define the standard for operational continuity in the coming years. Gartner estimates that 60 percent of enterprise networking teams will use AI-driven automation by 2026. Vis/ability acts as the central unifying hub for these insights. It ensures that when an AI model predicts a circuit failure or a server bottleneck, the relevant topology and live camera feeds appear on the screens before the outage occurs. This proactive posture is the only way to manage the complexity of modern, distributed architectures. Whether in a main command center, a remote breakout room, or on mobile devices, vis/ability provides the clarity required to act with certainty when stakes are at their highest.
For organizations that prioritize external transparency alongside internal efficiency, StatusPulse provides a dedicated platform for public status pages and uptime monitoring, ensuring that users and stakeholders are kept informed during service disruptions.
To ensure your facility is ready for the next generation of operational demands, consider how these elements integrate into your current setup:
- Automated Escalation: Systems must move beyond simple alerts to visual automation that directs attention to the most critical data.
- Platform Agnosticism: Visualization layers should run on standard IT hardware to avoid vendor lock-in and simplify maintenance.
- Cross-Functional Visibility: The NOC must be able to pull in data from physical security, cybersecurity, and facilities management tools without friction.
For more information on modernizing your facility, explore our solutions for SOC and NOC control rooms.
Modernize Your Operational Response
Fragmented systems and siloed data feeds create a dangerous gap in situational awareness. Most control rooms already have the screens. What they’re missing is the layer that decides what goes on them, and escalates automatically when something needs attention. Static dashboards aren’t enough to manage the complexity of 2026 infrastructure. You need a central hub that unifies every tool into a single common operating picture.
Effective network operations center visualization requires more than just pixels on a wall; it demands an intelligence layer that prioritizes critical events. Fortune 500 companies and federal agencies rely on vis/ability to provide event-driven situational awareness through seamless integration with existing monitoring tools. Whether you’re in a primary command center, a remote huddle room, or using a mobile device, the answer should appear exactly when it’s needed.
See how vis/ability can transform your NOC operations. Schedule a demo today.
Secure the future of your mission-critical operations with total visibility.
Frequently Asked Questions
What is the most important element of NOC visualization?
The most critical element is the automatic escalation of data based on pre-defined operational triggers. Most control rooms already have the screens. What they’re missing is the layer that decides what goes on them, and escalates automatically when something needs attention. Effective network operations center visualization requires more than just high resolution pixels; it needs the underlying logic to surface the 5 percent of data that actually requires a human decision. Without this, the video wall remains a passive backdrop.
How does event-driven visualization reduce operator fatigue?
Event-driven visualization reduces cognitive load by filtering out 90 percent of non-essential background noise. Operators often suffer from exhaustion when forced to monitor static dashboards during 12 hour shifts. The vis/ability platform changes this dynamic by keeping screens neutral until a specific threshold is met. This ensures the team only engages when an actual incident occurs, preserving their mental energy for critical problem solving during high pressure events where every second counts.
Can we use our existing video wall hardware with the vis/ability platform?
Yes, vis/ability integrates with 100 percent of standard professional video wall hardware and legacy display types. Most control rooms already have the screens. What they’re missing is the layer that decides what goes on them, and escalates automatically when something needs attention. Our platform functions as a software-defined intelligence layer that sits above your current infrastructure. It transforms existing hardware into a dynamic network operations center visualization hub without requiring a total equipment overhaul.
What is the difference between a NOC dashboard and a Common Operating Picture?
A dashboard typically displays isolated metrics for a single user, while a Common Operating Picture provides a unified view for the entire mission-critical team. Many organizations rely on fragmented tools, but these only provide a partial view of the field. Vis/ability creates a true Common Operating Picture by pulling data from every silo into one interface. This ensures that every stakeholder sees the same 1 source of truth simultaneously.
How do you manage multiple data feeds in a high-pressure dispatch center?
Managing multiple feeds requires a centralized hub that automates the layout of information based on the current threat level. You shouldn’t expect a dispatcher to manually toggle between 15 different applications during an emergency. Vis/ability solves how to manage multiple data feeds dispatch center by using rules-based logic to arrange relevant feeds automatically. When a call comes in, the system instantly pulls the nearest camera feeds and relevant GIS data onto the main display.
Why do operators often miss incidents even with a large video wall?
Operators miss incidents because of change blindness, where the human brain ignores subtle visual shifts on a crowded screen. Research indicates that monitoring accuracy drops significantly after just 20 minutes of passive viewing. This is why operators miss incidents video wall when the display remains static for long periods. Vis/ability eliminates this risk by using active alerts and visual cues to draw the eye specifically to the anomaly the moment it happens.
How can we extend NOC situational awareness to remote or mobile team members?
We extend awareness by pushing mission-critical visuals to any browser-enabled device via a secure link. Critical incidents don’t stop at the control room door; field commanders and remote executives need to see the exact same data. This solves common control room situational awareness problems by ensuring that decision makers have 100 percent visual parity. Whether they’re on a tablet or a laptop, the team stays synchronized with the central hub.
What are the benefits of a software-defined visualization layer over hardware-based systems?
A software-defined layer offers 10 times the flexibility of rigid, hardware-based matrix switchers that rely on proprietary cabling. Traditional hardware solutions create bottlenecks and expensive maintenance cycles. Vis/ability moves the processing to the network, allowing you to scale your operation instantly across multiple sites. It acts as the unifying hub for EOC common operating picture solutions, allowing you to add new data sources or remote sites in minutes rather than weeks.