

What if power grid management visualization could make fragmented operating data easier to act on without replacing the systems that run the grid? Operators rely on control applications and displays, yet critical context can remain scattered across separate tools. During a fast-changing event, teams may have to assemble the picture manually, while control-room and remote staff work from different views.
Fragmented systems, limited automatic escalation, and information silos make shared situational awareness harder to maintain. Most control rooms already have the screens. What they’re missing is the layer that decides what goes on them, and escalates automatically when something needs attention.
That layer is vis/ability, an operational intelligence layer that surfaces through the video wall. It brings relevant applications, real-time data, and video streams into a shared operating picture, complementing existing grid-control systems rather than replacing them. The video wall is where the answer appears because vis/ability directs essential information into view.
This article explains how to evaluate visualization for grid operations, connect it with existing control systems, and assess event handling and usability against operational needs. It also covers how to map information sources and escalation paths so operators and distributed teams can share context as grid conditions change.
Key Takeaways
- Identify fragmented applications, siloed data, and gaps in automatic escalation that make it harder to maintain shared event awareness.
- Most control rooms already have the screens. What they’re missing is the layer that decides what goes on them, and escalates automatically when something needs attention.
- Evaluate power grid management visualization by how well it brings relevant feeds into context and supports operator decisions, not by screen count.
- Map users, decisions, information sources, and escalation paths before designing shared views or deciding what belongs in individual applications.
- Position vis/ability as the operational intelligence layer that surfaces through the video wall, unifying relevant applications and data while complementing grid-control systems.
Power grid management visualization starts with fragmented operational data
Grid operations rely on separate applications, siloed data, and event notifications that may not share context. When conditions change, an operator may need to move between a grid map, system status, and related video or event information to understand what is happening. Colleagues elsewhere may see different details, making shared awareness harder to maintain.
Power grid management visualization presents relevant grid-operation information in a usable shared view. For teams facing control room situational awareness problems, the goal is to make related information easier to interpret together. The same principle informs EOC common operating picture solutions: teams need a shared view of relevant information to coordinate, while each operational system retains its defined role.
Visualization supports interpretation and coordination. It does not replace SCADA, EMS, DMS, or other grid-control systems, which retain their monitoring, analysis, and control responsibilities.
Most control rooms already have the screens. What they’re missing is the layer that decides what goes on them, and escalates automatically when something needs attention. vis/ability is an operational intelligence layer that surfaces through the video wall, bringing selected applications and data streams into a shared operating picture. The video wall is where the answer appears because vis/ability organizes and surfaces information for operators to review.
Why separate grid data feeds make incidents harder to interpret
When information is spread across applications, operators must assemble context: identify an event, locate related conditions in other systems, and communicate what they see. Each step depends on recognizing which information matters and how it connects. If teams work from disconnected views, they may not share the same understanding of an event or its current status.
For example, a developing condition may appear in a system-status view alongside a related alert or video feed in another application. Operators have to connect those details and relay context to colleagues. A shared operational picture can bring relevant information together while preserving the source applications for closer review.
What visualization adds to existing grid operations
Visualization organizes and presents information. It does not independently monitor grid assets, perform system analysis, or issue control actions. Those responsibilities remain with the operational systems designed to perform them. A shared view helps operators examine related information together, interpret events as a team, and coordinate next steps through established workflows.
The value depends on relevant context, clear prioritization, and escalation that directs attention when review is needed. The modern smart grid relies on communication and data exchange across grid components, making clear presentation important to human interpretation. For operators, a practical test is whether a view helps them understand what changed, what information relates to it, and who needs to know.
How a grid visualization layer turns live feeds into operational context
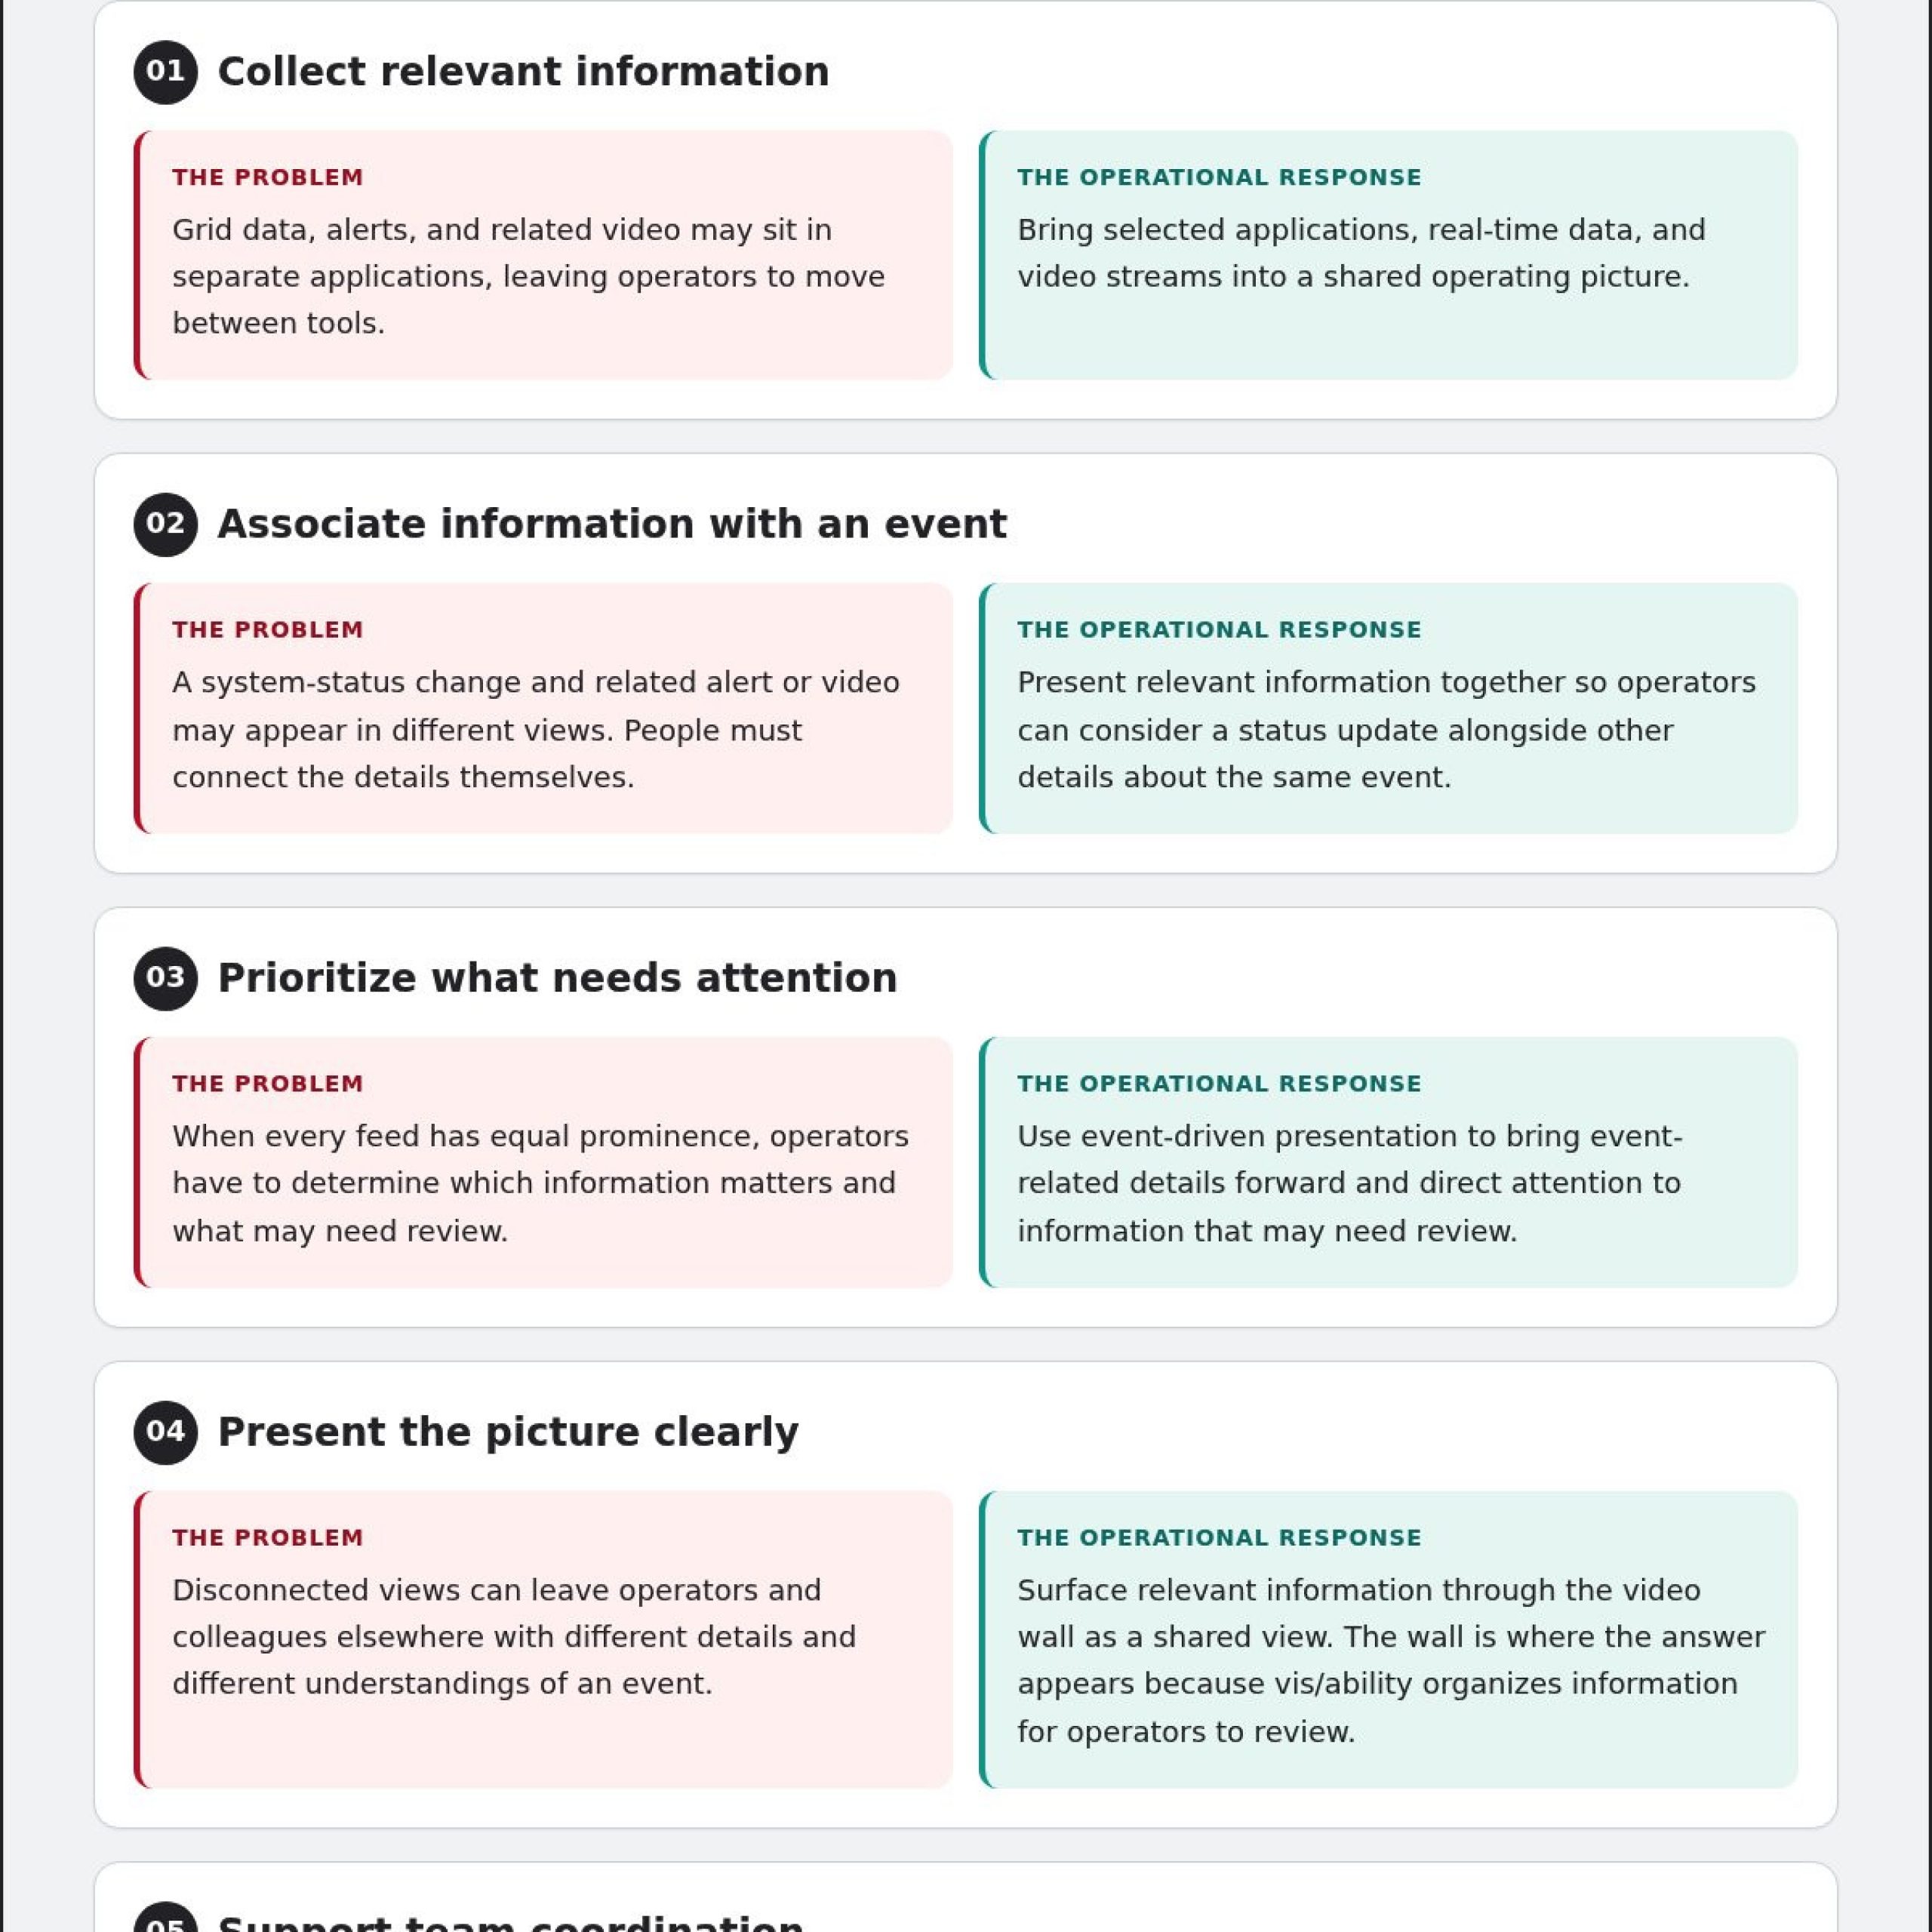
Turning live feeds into useful context takes a deliberate sequence: collect relevant information, associate it with an event, prioritize what needs attention, present it clearly, and support team coordination. Each step should serve an operator decision. The visualization layer organizes information from operational applications; it does not take over the monitoring, analysis, or control responsibilities of grid systems.
For teams asking how to manage multiple data feeds in a dispatch center or control room, the practical goal is to bring relevant sources into a shared view without losing their context or established workflows. vis/ability is an operational intelligence layer that surfaces through the video wall. The wall is where the answer appears because vis/ability brings selected information into view.
From connected applications to a shared operating picture
Application integration brings relevant sources into one operating picture. Teams can view operational data alongside video streams, for example, and consider a status update in relation to other information about the same event. vis/ability serves as the central hub where those tools and feeds come together, while operators continue using their established systems for grid operations.
Pacific Northwest National Laboratory’s ChatGrid visualization framework offers a research example of applying visualization to large-scale grid data. For utility teams, the operational question is how to present information in context so people can interpret it and coordinate from a shared view. Activu’s utilities and energy solutions support shared operational visibility for utility teams.
Event-driven visibility, prioritization, and escalation
Event-driven presentation can direct attention to information that may need review. Instead of giving every feed equal prominence, a view can bring event-related details forward for operators to assess and handle through established workflows. Escalation connects an event to the people or process that need to address it. It supports operator attention without transferring decision authority from the team or control systems.
Event context explains why information matters; prioritization helps operators decide where to look next. Evaluate whether teams can identify an event, understand its related information, and coordinate using the systems and procedures already in place. Shared views can also extend to remote users, helping distributed teams stay aligned around relevant operational context.
Compare grid visualization approaches by operational fit, not screen count
Fragmented systems, information silos, and gaps in automatic escalation can persist even when a control room has multiple displays. The key question is whether teams can see relevant information together and understand what needs attention.
A video wall can display selected feeds, but the display alone does not connect their context, prioritize events, or establish escalation workflows. Compare each technology by its operational role and how it fits with existing systems.
Visualization versus SCADA, EMS, and DMS
SCADA, EMS, and DMS have distinct monitoring or management roles in grid operations. Visualization serves a different purpose: it presents relevant information from operational and supporting applications in a shared view. It complements established grid-control environments, leaving their operational authority and workflows intact.
Approach | Purpose and information | Operator workflow | Relationship to existing systems
Visualization: Organizes relevant data and video in a shared operating picture. Helps teams interpret context and coordinate. Sits alongside source applications and grid-control systems.
SCADA: Supports supervisory monitoring and control of grid operations. Operators work within its operational environment. Visualization may present relevant information from it without taking over its role.
EMS: Supports energy-system management. Operators use its functions for grid operations. Visualization complements it by making selected information available in a broader shared view.
DMS: Supports distribution-system management. Operators continue to use its operational workflows. Visualization can bring relevant context into the common picture.
Analytics: Examines data to support analysis. Teams use its outputs alongside operational information. Visualization can help present relevant results in context.
Individual application dashboards: Show information within a particular application. Operators work within each tool’s view. A visualization layer can connect selected views for shared awareness.
A practical framework for evaluating operational fit
Assess power grid management visualization against the work operators need to do, not the number of feeds or screens it can display. Ask whether the approach can:
- Bring relevant applications together while preserving the context and source of their information.
- Prioritize event-related details so operators can identify what warrants attention.
- Share a consistent view across control-room and remote workspaces, supporting coordination without changing grid-control authority.
These criteria help distinguish a coordinated operating picture from a collection of visible but disconnected feeds. For guidance on designing shared awareness in control rooms, explore this video wall and control-room situational awareness guide.
Plan power grid management visualization around operator workflows
Start planning with the decisions operators make, not with a list of available feeds. Map who needs to act, what information informs each decision, where that information lives, and how an event moves between people or teams. This reveals which details need shared visibility and which are best handled within an individual application.
Use that map to define which events should bring information forward and who owns the next step. Document handoffs and escalation paths, and note where workflows differ by event type. This makes it easier to design views around actual responsibilities instead of treating every alert the same way.
Map operational decisions to information and escalation
For each recurring decision, identify the information operators need, the application that provides it, and the role responsible for reviewing it. Then trace event ownership through any team handoffs. For example, a developing grid condition may call for a shared status view while detailed investigation remains within the relevant operational application. A clear map helps teams distinguish what everyone needs to see from what a specific operator must manage in a source system.
Review these workflows with the people who use them. Their input can clarify which events warrant escalation, what context should accompany them, and where responsibilities shift. This gives visualization a practical role in incident coordination while leaving operational decisions with the appropriate teams.
Design shared views for control rooms and distributed teams
Plan views for the places where coordination happens: command centers, remote locations, conference rooms, breakout rooms, and huddle rooms. A consistent shared picture helps participants discuss the same event with relevant context in view. Mobile access can extend that visibility to users away from those workspaces, supporting coordination without requiring everyone to be at one display.
Decide who owns each view and who reviews its relevance as applications, responsibilities, or operating workflows change. Assigning that ownership helps keep shared information aligned with current operational needs. vis/ability supports this approach as the central hub for relevant applications and data, with the operational intelligence layer surfacing through the video wall where that shared view is needed.
For more on how this planning applies to utility operations, review Activu’s utilities and energy solutions.
How Activu supports power grid management visualization
Fragmented applications, siloed information, and gaps in event escalation can make it difficult for grid teams to maintain a shared view of changing conditions. Activu’s vis/ability platform addresses this operational need by bringing relevant applications and data streams into a central hub. It complements existing grid-control systems, which retain their monitoring and control roles.
vis/ability is an operational intelligence layer that surfaces through the video wall. The wall is where the answer appears because vis/ability organizes relevant information for operators and teams to review together.
A unified operating picture across control-room environments
vis/ability aggregates real-time data and video streams to support situational awareness. Application integration brings relevant sources into a shared operational view, while event-driven situational awareness helps direct attention to information that may need review. The platform serves as the hub: tools and data flow into a common picture, and teams retain their established workflows for investigation and operational decisions.
That shared view can support coordination in command centers, remote locations, conference rooms, breakout rooms, and huddle rooms. Mobile vis/ability extends visibility to users away from those workspaces. Activu also provides control-room design services tailored to operational needs, helping align shared views with the teams, decisions, and workspaces they support. Explore the vis/ability operational intelligence platform to see how it brings applications and data streams together.
Next steps for evaluating a visualization solution
Begin with an inventory of current information feeds, user groups, operating locations, and event escalation needs. Then evaluate whether a visualization approach can connect relevant applications, present event context clearly, and support collaboration across control-room and remote teams. Keep the criteria tied to actual operator workflows, and identify who will review shared views as those workflows evolve.
Power grid management visualization should make the information behind a decision easier to find and share while leaving grid-control authority where it belongs. Use these criteria to define the operational needs your shared view must support.
Turn operational data into clearer grid decisions
Power grid management visualization works best when it fits operator workflows, brings relevant information into context, and supports coordination without replacing established grid-control systems. Fragmented applications, information silos, and gaps in automatic escalation can leave teams assembling the picture across separate tools.
vis/ability acts as a central hub, aggregating real-time data and video streams for situational awareness, while Mobile vis/ability extends visibility beyond the control room.
Start by mapping the people, information, decisions, and escalation paths that shape your operations. Then assess whether shared views support teams across their workspaces and help them focus on relevant events. Contact Activu to discuss power grid management visualization for your control-room workflows and distributed teams.
Frequently Asked Questions
What is power grid management visualization?
Power grid management visualization presents relevant grid-operation information in a shared, interpretable view. It can help teams assemble context across applications, identify information that needs attention, and coordinate decisions from a common picture. Visualization organizes and displays information. SCADA, EMS, DMS, and other established systems retain their roles in monitoring, managing, or controlling grid assets. Its value depends on useful context and fit with operator workflows.
How does visualization help manage multiple data feeds in a control room?
Visualization can bring selected operational data and video into a unified operating picture through application integration. By presenting related information with context and clear prioritization, a shared view can reduce the need to move between disconnected displays to build an overall picture. Operators still use their established source systems to investigate conditions and follow operating procedures. The visualization layer supports interpretation and coordination; it does not take over grid-control responsibilities.
Does a grid visualization platform replace SCADA, EMS, or DMS?
No. A grid visualization platform complements SCADA, EMS, and DMS rather than replacing their monitoring, management, or control roles. It can present relevant information from connected applications in a shared view, helping teams maintain situational awareness and coordinate. System responsibilities should remain clear: established operational systems retain their authoritative roles, while visualization supports how people see and discuss information. Evaluate the approach within the context of your existing systems and operating workflows.
What should utilities consider when evaluating grid management visualization?
Start with operational decisions and the information teams need to make them, rather than display specifications. Assess whether the approach can connect relevant applications, preserve event context, prioritize information, and support escalation workflows. Consider shared views for distinct user groups, collaboration across workspaces, and mobile access where it fits operations. Finally, evaluate how visualization complements existing systems and responsibilities, including how teams will maintain views as their needs change.
Can power grid visualization support teams outside the control room?
Yes. Activu’s Mobile vis/ability extends visibility to users beyond the control room, supporting shared operational context across distributed teams. Teams may also need to coordinate from remote locations and meeting spaces, such as conference or huddle rooms. Plan shared views around the context each group needs, while keeping detailed investigation and operational actions within the appropriate source systems.
Why can operators miss important events when information is spread across separate systems?
Separate applications can require operators to assemble context manually and move between different views. That can make it harder for a team to share the same picture, recognize which information needs attention, and coordinate around an event. It does not mean an event will be missed or reflect operator performance. Event-driven visibility can help surface relevant context, while clear escalation workflows show who needs to review or act on it.