
If your team measures success by uptime alone, they are likely blind to the very incidents that threaten your mission. In an era where 87% of enterprises report cloud blind spots, relying on fragmented data silos only increases the risk of a catastrophic oversight. You likely struggle with operator fatigue from irrelevant alerts and an inability to quantify the true value of your operations to stakeholders. Establishing effective key metrics for a network operations center is no longer just about tracking packet loss or latency. It’s about building a foundation of technical reliability that provides calm and clarity when stakes are at their highest.
Most control rooms already have the screens. What they’re missing is the layer that decides what goes on them, and escalates automatically when something needs attention. This article provides the framework to move beyond simple monitoring toward true, event-driven situational awareness. We’ll explore how to implement an operational intelligence layer that unifies disparate tools into a single common operating picture. By the end, you’ll know how to reduce incident response times, improve visibility for distributed teams, and justify your technology investments with hard, verifiable data.
Key Takeaways
- Identify why standard IT metrics fail to account for the human element in command and control settings.
- Master the essential key metrics for a network operations center to move beyond simple monitoring toward event-driven intelligence.
- Implement a proactive framework for measuring situational awareness to maintain a unified common operating picture across distributed teams.
- Audit video wall utilization to confirm that your visual assets are providing the bridge between raw data and human judgment.
- Learn how the vis/ability platform acts as an operational intelligence layer to automate escalation and reduce response times.
Why Traditional NOC KPIs Fail in Mission-Critical Environments
Traditional performance indicators often prioritize technical availability over operational readiness. While standard IT departments might celebrate 99.9% uptime, mission-critical environments recognize that a functioning network is useless if the personnel can’t see a developing crisis. This disconnect defines the failure of many key metrics for a network operations center. When teams rely on time-averaged data, they miss the transient anomalies that signal a breach or a system failure. This creates “green dashboard syndrome,” a state where every light on the console is green while the operation is actually blind to an emerging threat.
Mission-oriented environments require a shift from passive monitoring to active intelligence. Raw network data is just noise unless it is processed through the lens of human judgment. Relying on generic uptime stats ignores the human element of command and control. If a metric doesn’t help an operator make a faster, more accurate decision during a crisis, it isn’t a metric worth tracking. High-stakes operations demand event-driven data that highlights deviations from the norm in real time, providing the bedrock for absolute technical reliability.
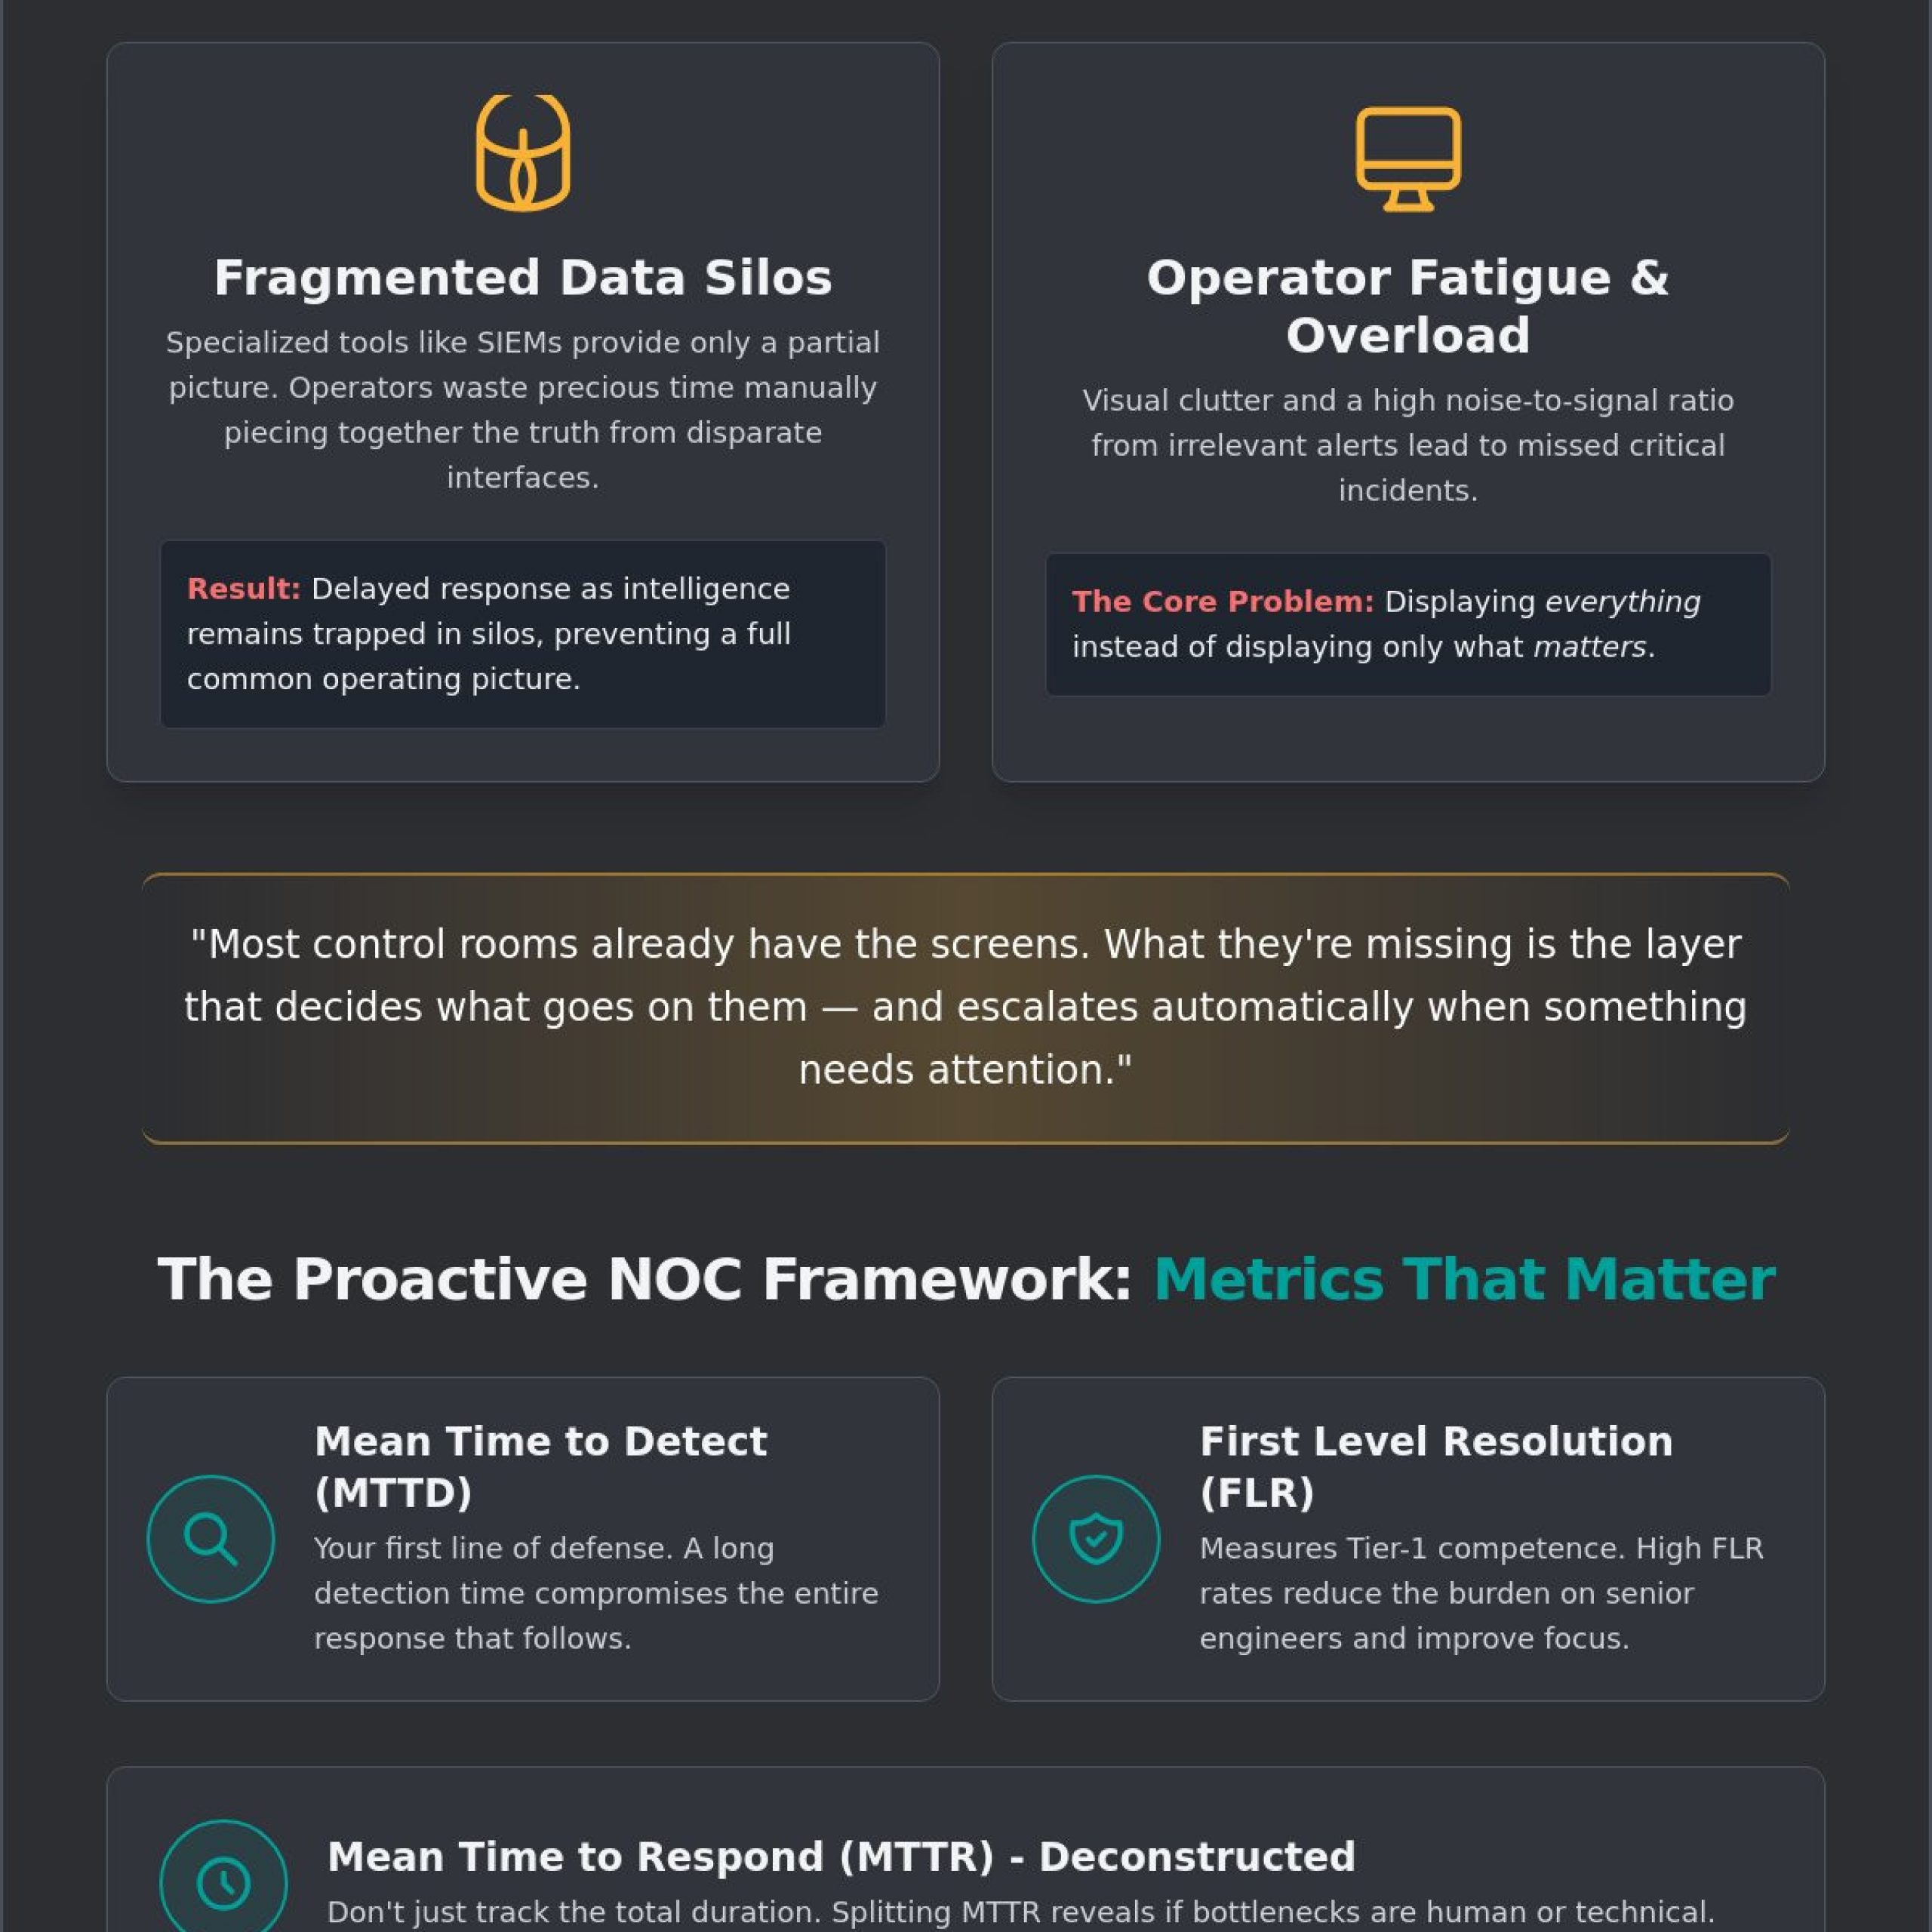
The Problem with Fragmented Data Silos
Data fragmentation is the primary enemy of rapid response. Many organizations use specialized tools like Axon or generic SIEM platforms to monitor specific segments of their infrastructure. While these tools are capable in their narrow domains, they only provide a partial solution. They lack a unifying layer to create a full common operating picture. During a high-stakes event, operators must jump between disparate interfaces to piece together the truth. This manual synthesis wastes precious seconds. A Network Operations Center (NOC) cannot function at peak efficiency when its intelligence is trapped in silos. Without a central hub, metrics remain abstract numbers rather than actionable insights. You can find more about specialized control room environments that solve these visibility gaps through integration.
Operator Fatigue and Cognitive Overload
Visual clutter is the primary reason operators miss critical incidents. When a video wall is treated as a catch-all for every possible data feed, the noise-to-signal ratio becomes unmanageable. Irrelevant alerts compete for attention with mission-critical events, leading to cognitive fatigue. Most control rooms already have the screens. What they’re missing is the layer that decides what goes on them, and escalates automatically when something needs attention. Effective key metrics for a network operations center must account for this human element. If your display doesn’t prioritize essential information during a pivotal decision, the technology has failed its users. True operational intelligence requires shifting from displaying everything to displaying only what matters.
Essential Efficiency Metrics: MTTD, MTTR, and Beyond
Efficiency in a high-stakes environment isn’t about clearing a high volume of tickets. It’s about protecting mission-critical functions through rapid, accurate intervention. Mean Time to Detect (MTTD) serves as your first line of defense. If detection lags, the subsequent response is already compromised. However, measuring key metrics for a network operations center requires looking deeper than just total duration. You must divide Mean Time to Respond (MTTR) into two distinct phases: acknowledgment and resolution. A quick acknowledgment shows your operators are vigilant. A fast resolution proves your technical procedures are sound. When these phases are lumped together, you lose the ability to identify whether your bottleneck is human attention or technical complexity.
First Level Resolution (FLR) rates offer a clear window into tier-1 competence. When operators resolve incidents without escalation, they reduce the burden on senior engineers and keep the focus on strategic oversight. This efficiency relies entirely on escalation accuracy. If the wrong stakeholder receives the alert, the response chain breaks, and the mission is put at risk. Organizations should follow established NOC best practices to ensure that information flows through the correct channels immediately, ensuring that key metrics for a network operations center reflect a team that is both fast and precise.
Quantifying Incident Impact and Severity
High-stakes environments cannot treat all alerts equally. Weighting your metrics by mission-criticality prevents minor issues from masking severe threats. A network failure in a secondary office is a nuisance; a failure in a primary command center is a crisis. Calculating the true cost of downtime helps justify investments in visibility and infrastructure. Beyond active incidents, tracking “near-misses” is vital. These events identify systemic weaknesses before they manifest as outages, allowing for proactive hardening of the environment.
SLA Compliance vs. Operational Reality
Meeting a Service Level Agreement (SLA) provides a contractual safety net, but it doesn’t guarantee mission success. Speed is dangerous without accuracy. If an operator closes a ticket quickly but fails to address the root cause, the “efficiency” is an illusion. Balancing these factors is a hallmark of high-performing SOC/NOC Control Rooms. Most control rooms already have the screens. What they’re missing is the layer that decides what goes on them, and escalates automatically when something needs attention. Without this intelligence, metrics only document failures rather than preventing them. Integrating an operational intelligence layer ensures that your team acts with certainty when the stakes are highest.
Measuring Situational Awareness: The Proactive NOC Framework
Situational awareness is often treated as a subjective state of mind, but in high-stakes environments, it must be codified as a measurable operational KPI. It represents the bridge between raw data and human judgment. One of the most critical key metrics for a network operations center is the Common Operating Picture (COP) Index. This metric quantifies the alignment between different operational tiers. If your command center operators see a different reality than your field teams, your COP index is low, and your risk of a misinformed decision is high. True awareness requires that every participant, regardless of location, accesses the same prioritized intelligence at the same time.
To achieve this, you must measure your Cross-Platform Integration Rate. This tracks how many disparate tools, from cybersecurity sensors to physical security feeds like Axon, flow into your central hub. While some organizations use these tools in isolation, they only provide a partial solution. They lack the unifying layer required to create a full common operating picture. Collaboration velocity is the final piece of this framework. It measures the time taken to share a critical feed with field units or mobile devices. In a crisis, speed of distribution is just as vital as speed of detection.
The Role of Event-Driven Intelligence
Transitioning from constant monitoring to exception-based management is essential for reducing cognitive load. Most control rooms already have the screens. What they’re missing is the layer that decides what goes on them, and escalates automatically when something needs attention. By tracking metrics for automated escalation, you can determine how often the system successfully prioritized a threat before an operator had to find it manually. This reduces “Time to Glass” for high-priority alerts, ensuring that the most critical information reaches the video wall the moment it becomes relevant.
Distributed Team Visibility
Operational intelligence must extend beyond the physical walls of the command center. Measuring access to the COP for mobile and remote decision-makers ensures that huddle rooms and field units remain synchronized with the main operation. The vis/ability Platform serves as the operational intelligence layer that makes other tools useful for the entire team. By tracking the effectiveness of these distributed units, you can justify technology investments that empower individuals to act with greater certainty. This proactive approach transforms the NOC from a reactive cost center into a powerful engine for organizational safety and reliability.
Operationalizing Metrics: Visibility and Information Prioritization
Measure the value of your visual assets by their impact on decision-making speed. Video wall utilization is a critical component of key metrics for a network operations center, yet many organizations leave screens static or cluttered with irrelevant data. This inefficiency explains why operators miss incidents on the video wall; the human brain cannot process a dozen competing data streams simultaneously. True operational readiness requires a shift from simply displaying data to prioritizing intelligence. You must track how often your visual centerpiece actually displays the information required for a pivotal decision. If the content on your screens doesn’t provide the bridge between raw data and human judgment, the asset is underperforming.
Information density and contextual switching speed are equally vital. In high-stakes environments, the ability to pivot between different data sets during a multi-vector incident determines the success of the mission. Most control rooms already have the screens. What they’re missing is the layer that decides what goes on them, and escalates automatically when something needs attention. By measuring the speed at which your team can transition from routine monitoring to crisis management, you gain a clear view of your operational agility. This methodology ensures that key metrics for a network operations center reflect the reality of the command floor rather than just the state of the servers.
Visualizing Threat Intelligence
A cybersecurity common operating picture is essential for accelerating incident response. Integrating SIEM and SOAR data into a unified visual layer allows your SOC to act with absolute technical reliability. Fragmented tools only provide a partial view, often delaying the moment of clarity needed to stop a breach. By consolidating these feeds, you ensure that every stakeholder sees the same truth in real time. For those managing complex environments, exploring an integrated operational intelligence layer is the next logical step in maturing your response capabilities.
Reducing Cognitive Load Through Automation
Automation is the only way to effectively manage the noise-to-signal ratio in a modern NOC. You should track “Screen Relevance” as a metric, calculating the percentage of time your video wall shows mission-critical feeds versus background noise. Automation reduces the manual burden of wall management, freeing operators to focus on analysis rather than window placement. This structured approach to visual distribution is a hallmark of high-performing SOC/NOC control rooms. When the system handles the prioritization, the team acts with greater certainty.
Enhance your operational visibility today. Contact our team to discuss your control room design.
vis/ability: The Operational Intelligence Layer for Automated Escalation
Performance metrics are often relegated to post-incident reports, existing as static numbers in a database. In high-stakes environments, this lag is unacceptable. To achieve true mission-critical intelligence, your key metrics for a network operations center must function as dynamic triggers for action. Most control rooms already have the screens. What they’re missing is the layer that decides what goes on them, and escalates automatically when something needs attention. The vis/ability platform serves as this operational intelligence layer, transforming your command center from a reactive environment into a proactive engine of certainty.
Specific integrated technologies like Axon provide essential data, but they only offer a partial solution. They lack the unifying architecture required to synthesize disparate feeds into a common operating picture. Without a central hub, your team remains trapped in a cycle of manual monitoring and delayed response. The vis/ability platform acts as the bedrock for your operation, integrating complex applications and data streams into a single, cohesive interface. This allows your personnel to focus on high-level decision-making rather than the mechanics of data retrieval, ensuring that the human element is always supported by technical reliability.
Beyond Standard Video Wall Software
Relying on basic video wall software is no longer sufficient for modern operational demands. These systems often act as simple display drivers, failing to prioritize information based on real-time urgency. By contrast, vis/ability prioritizes essential information, ensuring that your most expensive visual assets are always showing the most important data. It bridges the gap between raw data and human judgment, empowering individuals to act with greater certainty. For organizations seeking to modernize their infrastructure and exit the pain of siloed information, you can contact Activu for a comprehensive control room design consultation.
Building a Future-Proof NOC in 2026
As we look toward the operational landscape of 2026, the volume of data generated by multi-cloud and hybrid networks will continue to expand. Managing this complexity requires a platform that scales with your data and eliminates visibility gaps. The vis/ability platform is designed for these distributed environments, providing a unifying layer that makes other tools useful for the entire team. This intelligence flows seamlessly between the command center, huddle rooms, and mobile devices.
Exiting the state of fragmented data and operator fatigue requires more than just better screens. It requires a fundamental shift in how key metrics for a network operations center are operationalized. By implementing an event-driven situational awareness framework, you ensure that your NOC moves beyond simple uptime monitoring toward true intelligence. This logical progression creates a state of clear, actionable intelligence, positioning your brand as a vigilant guardian of critical infrastructure.
Establishing Operational Dominance Through Intelligence
Transforming your command center requires moving beyond passive monitoring toward a framework of event-driven situational awareness. By implementing the right key metrics for a network operations center, you shift the focus from simple uptime to the speed and accuracy of human judgment. You’ve learned that reducing incident response times depends on eliminating fragmented silos and prioritizing essential information on your video walls. Most control rooms already have the screens. What they’re missing is the layer that decides what goes on them, and escalates automatically when something needs attention.
This operational intelligence layer is the bedrock for organizations like Federal Defense agencies and global utilities. It provides a unified view across video walls, desktops, and mobile devices, ensuring that every team member acts with absolute certainty. You can now bridge the gap between raw data and pivotal decisions with a platform built for high-stakes reliability. By aligning your technology with the human element of operations, you ensure that your team remains focused and analytical when the stakes are at their highest.
Request a Demo of the vis/ability Operational Intelligence Layer to secure your mission and achieve absolute clarity.
Frequently Asked Questions
What are the most important KPIs for a Network Operations Center?
The primary key metrics for a network operations center include Mean Time to Detect (MTTD), Mean Time to Respond (MTTR), and First Level Resolution (FLR) rates. While these measure speed and technical efficiency, advanced centers also track the Common Operating Picture (COP) Index to quantify situational awareness. These metrics ensure the operation maintains absolute technical reliability during high-stakes events.
How do NOC metrics differ from SOC metrics?
NOC metrics focus on network availability and performance, while SOC metrics prioritize threat detection and security posture. Despite these different goals, mission-critical environments require the integration of both data sets into a unified view. Most control rooms already have the screens. What they’re missing is the layer that decides what goes on them, and escalates automatically when something needs attention.
How can I reduce operator fatigue in my NOC?
Reducing fatigue requires a significant reduction in the noise-to-signal ratio through intelligent alert prioritization. Operators miss critical incidents when screens are cluttered with irrelevant data. Implementing an operational intelligence layer filters out non-essential alerts, ensuring only mission-critical information reaches the team. This allows individuals to act with greater certainty rather than reacting to every minor anomaly.
What is the ‘Time to Glass’ metric in a control room?
Time to Glass measures the duration between an incident’s detection and its visual representation on a command center display. This is a vital metric for decision-makers who rely on immediate visibility to manage crises. Minimizing this time ensures the bridge between raw data and human judgment is as short as possible, facilitating faster and more accurate intervention.
Why is a Common Operating Picture (COP) important for NOC metrics?
A Common Operating Picture is the bedrock of a coordinated response. Without it, distributed teams and mobile units operate on fragmented information, which leads to conflicting decisions. Measuring the COP Index ensures everyone in the operation is seeing the same truth in real time. This alignment is essential for maintaining operational readiness across complex, distributed infrastructure.
How does automation improve NOC efficiency?
Automation improves efficiency by handling routine technical tasks and manual display management. It allows the system to handle the prioritization of data, which reduces the cognitive load on human operators. When automated triggers manage the visual environment, the team remains focused on high-level analysis and critical decision-making rather than navigating complex software menus.
What is the difference between reactive and proactive NOC monitoring?
Reactive monitoring documents failures after they happen, while proactive monitoring identifies the precursors to an incident. Proactive centers use event-driven intelligence to detect anomalies before they result in downtime. This transition transforms a cost center into a proactive engine of reliability, shifting the focus from fixing problems to preventing them entirely.
Can I integrate existing tools like Axon or Splunk into a unified NOC view?
Organizations can integrate tools like Axon or Splunk into a unified view, but these platforms only provide a partial solution on their own. They require an operational intelligence layer like vis/ability to synthesize their data into a full common operating picture. This unification makes disparate tools useful for the entire team, whether they are in a command center or using mobile devices.