
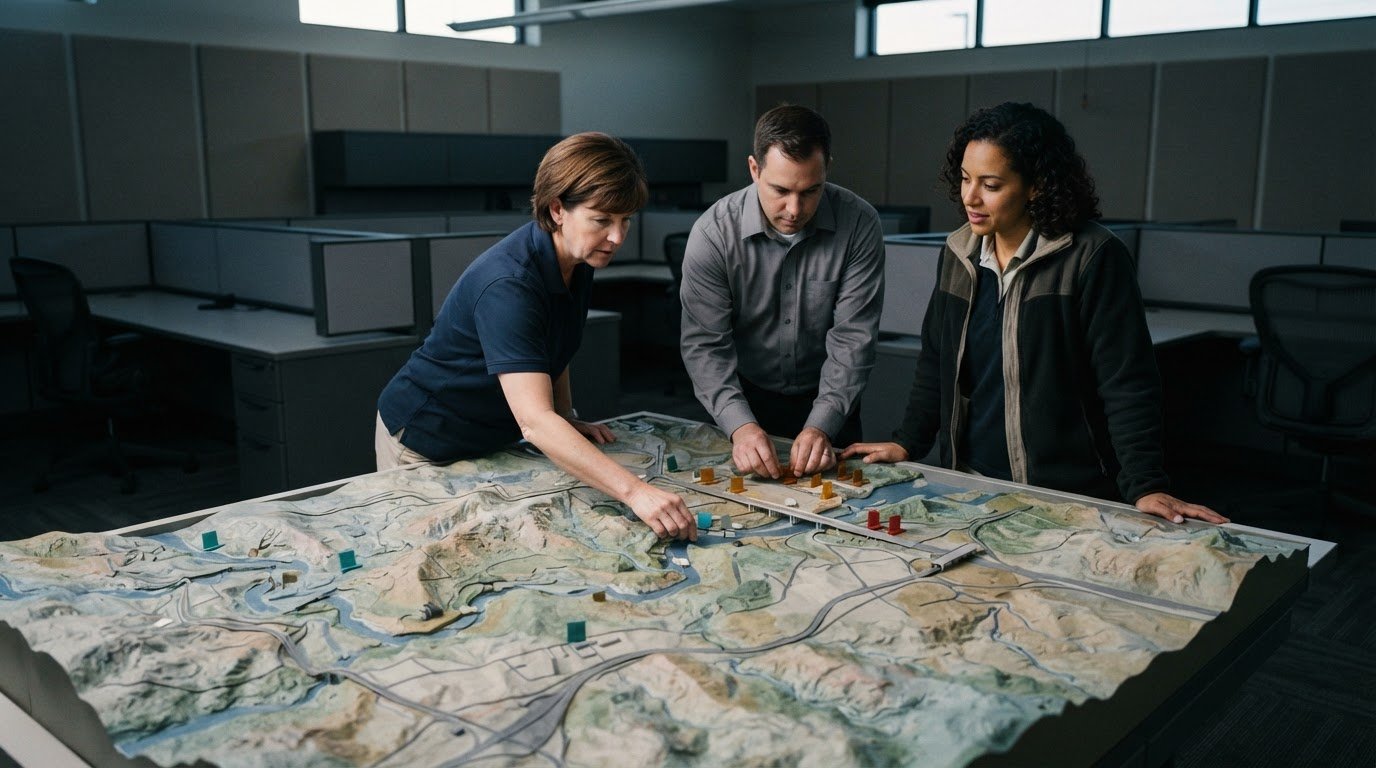
Emergency operations center visualization brings maps, alerts, dashboards, video, and other operational information together to support shared awareness. Effective displays help teams see what is happening, understand how information relates, and assess how conditions may develop. Clear priorities matter: fragmented feeds and delayed escalation can leave operators without a timely, shared picture.
Teams need more than information on screens. They need a consistent view that supports coordination across roles and workspaces. This guide explores practical emergency operations center visualization examples, from hazard maps and status dashboards to alerts and collaborative workspaces. You’ll see how these tools can help teams assess developing hazards, share updates, and focus on information that supports the next decision.
Key Takeaways
- Connect operational feeds across shared displays and workspaces so teams can work from a more consistent picture.
- Organize information to help operators identify current conditions, understand their significance, and assess what may happen next.
- Use dashboards and alerts to direct attention to changing priorities, while collaboration spaces keep teams aligned.
- Combine maps and incident information to support hazard assessment and clarify impacts on people, assets, and response activity.
- Match what appears on each display to the room, the information, and the people who need to act on it.
Interoperability across EOC displays and workspaces
Fragmented systems, information silos, and missing automatic escalation can split an EOC’s operating picture. One team may follow weather updates while another monitors field reports or GIS layers. Most control rooms already have screens. What they need is a way to determine what appears on them and automatically escalate information that needs attention. Interoperable software can connect separate inputs and direct relevant information to the teams that need it. In the United States, EOCs operate within the National Incident Management System framework, which calls for communications and information management systems to account for interoperability and redundancy.
A unified display can bring video feeds, weather patterns, GIS maps, and social media information into a shared view. During a severe weather response, for example, an EOC team could compare a storm map with road conditions and field video. The display helps staff spot relationships across feeds, while source labels and update times help them interpret what they see. A common operating picture should distinguish confirmed information from reports still being assessed. This gives government departments and response partners a consistent reference during briefings, even when they use different applications at their workstations.
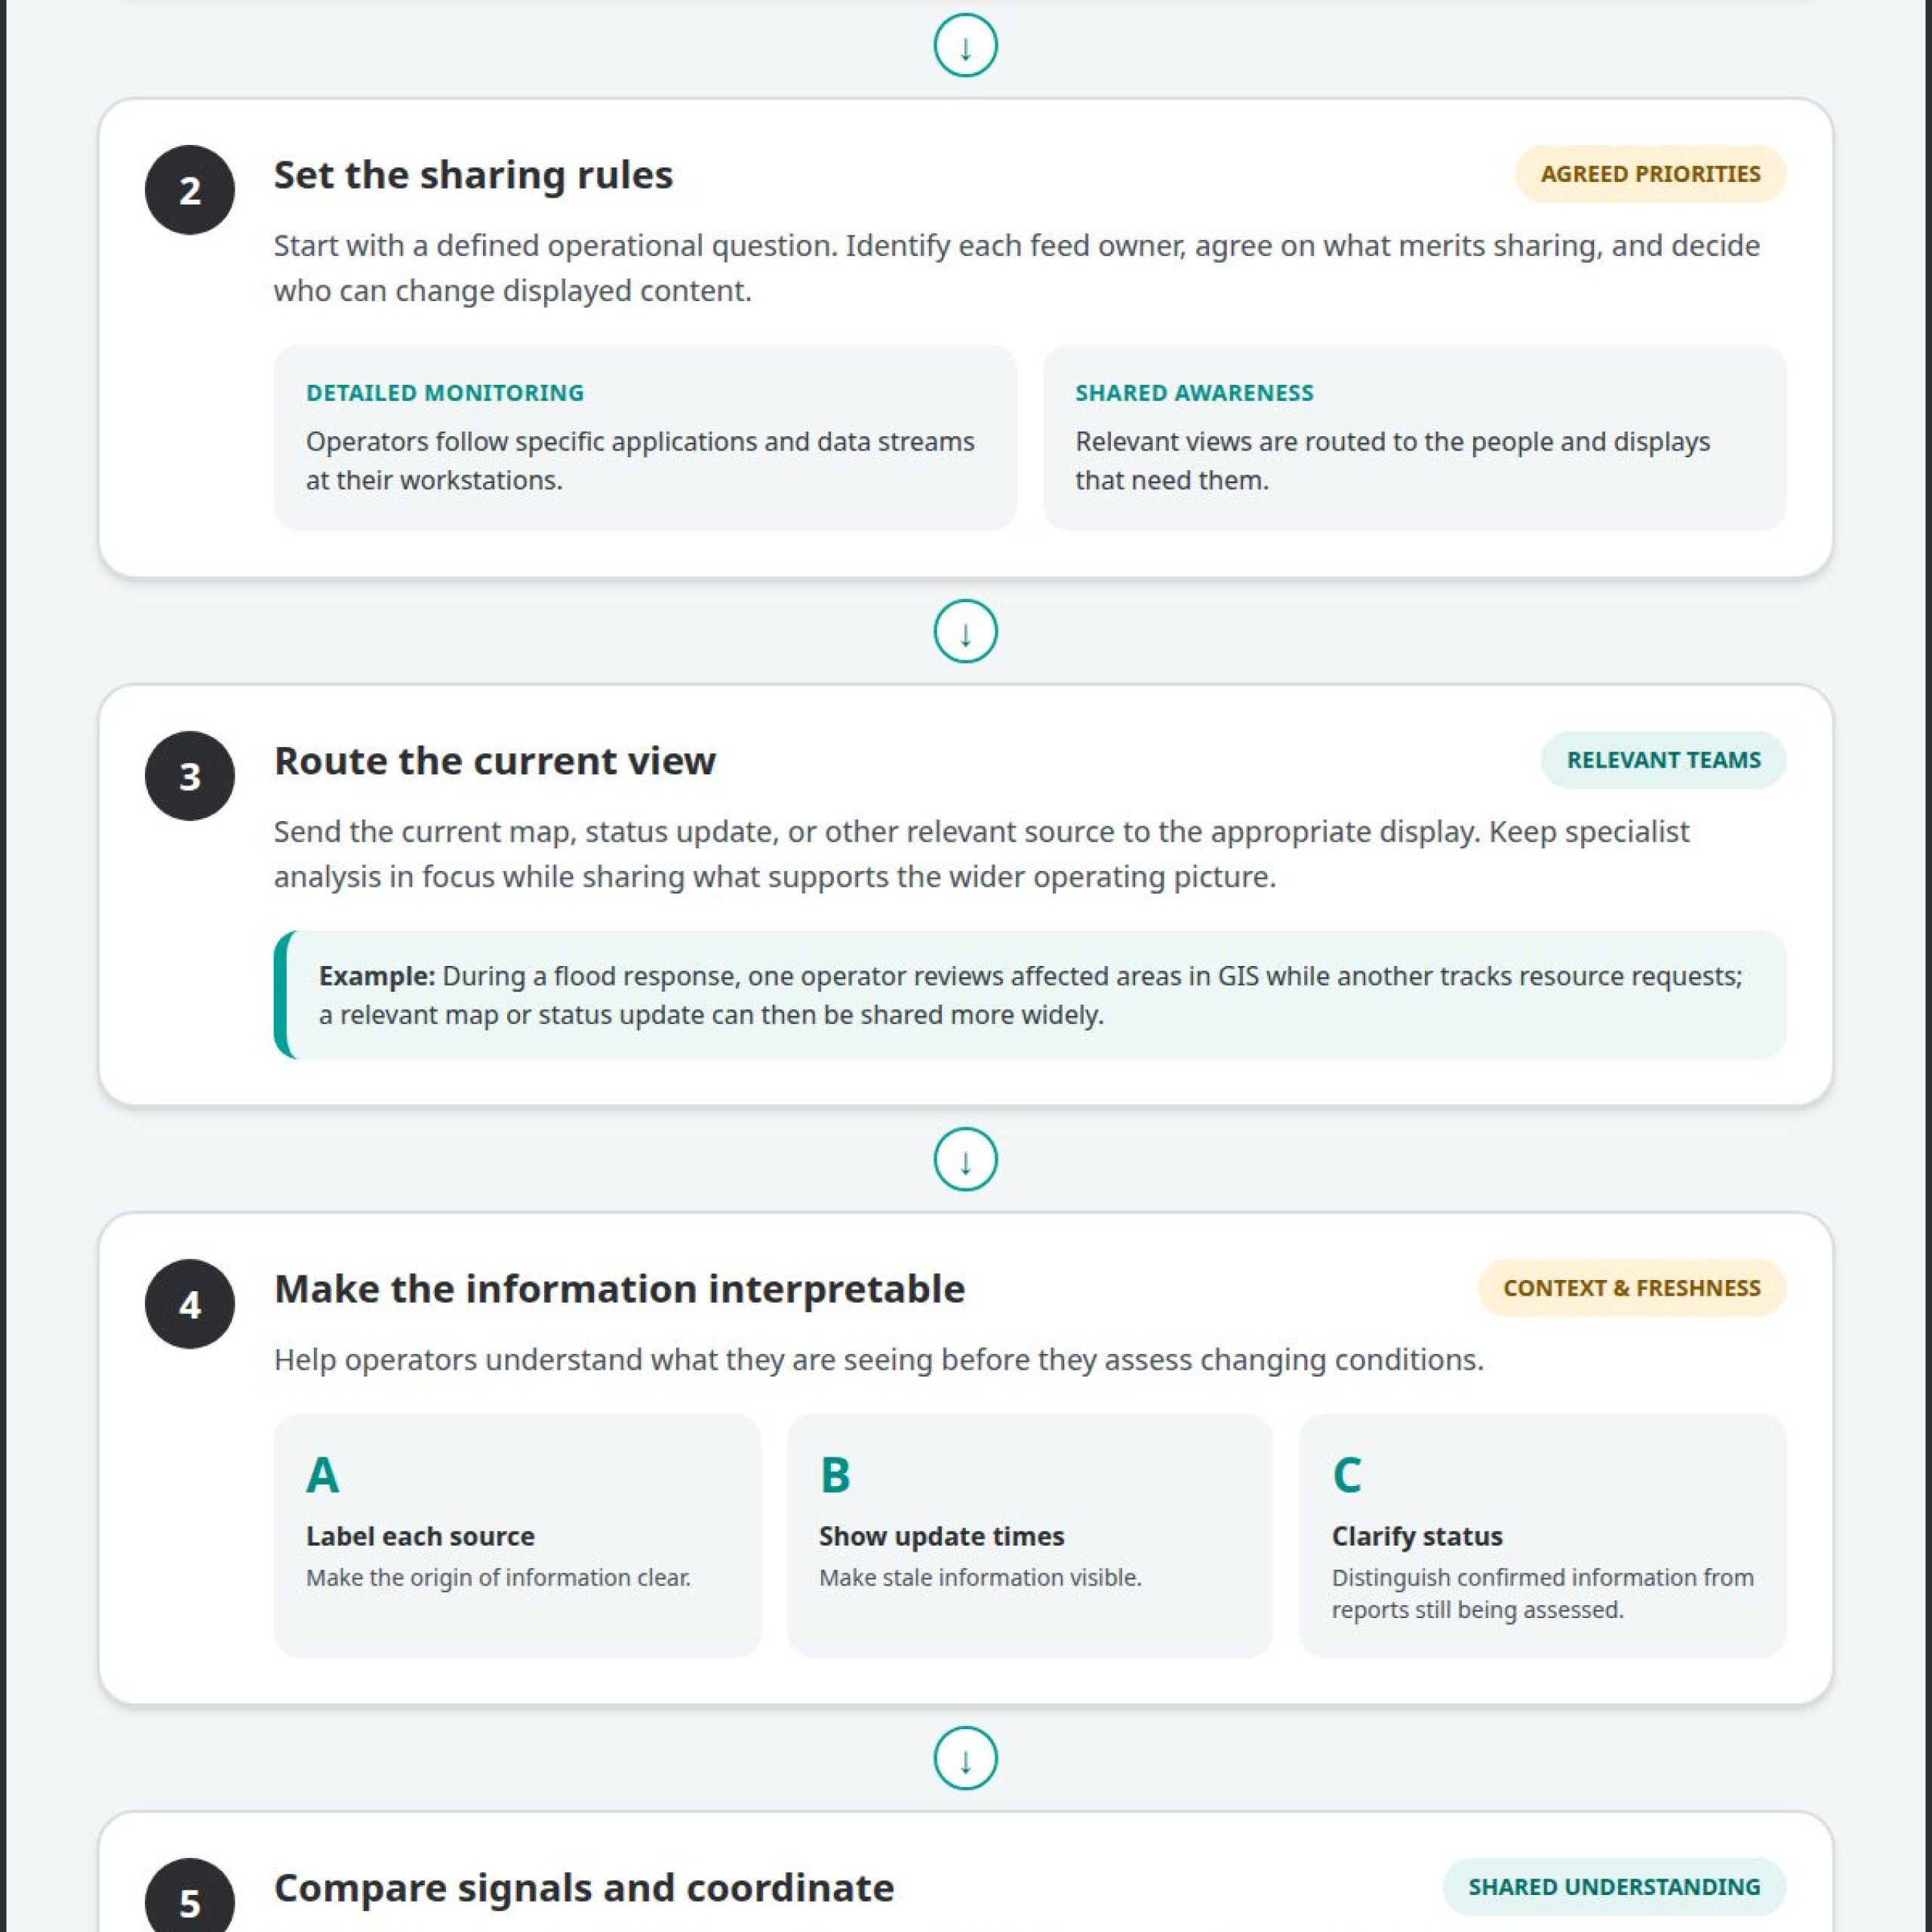
Individual workstation displays serve a different purpose. They let operators monitor specific applications and data streams in detail without putting every feed on the shared display. During a flood response, a GIS operator might review affected areas while another staff member tracks resource requests. The team can then share a relevant map or status update more widely. A practical workflow is to identify the feed owner, agree on what merits sharing, and route the current view to the appropriate display. This preserves specialist focus while helping teams work from connected information.
Interactive whiteboards and displays support collaborative planning. In a planning meeting, staff can annotate an evacuation map, mark access constraints, and record unresolved questions. The group can turn those notes into assigned tasks or briefing updates. A centralized touch-panel control system can help staff manage video sources, audio levels, and video conferences through one interface, reducing the need to switch among separate controls during a discussion. The display becomes a working surface for shared decisions, not simply a place to show information.
Interoperability also depends on how information moves between rooms and roles. EOC content management and distribution systems can route sources to displays across the center. Teams should define which feeds support individual analysis, which need to be shared, and who can change displayed content. They should also plan for redundancy so essential communications and information remain accessible if a connection or system fails. EOC staff support incident management rather than directly managing incidents; connected workspaces help them coordinate information, planning, and support. The result is a clearer handoff from detailed monitoring to shared awareness and coordinated action.
Situational awareness through perception, comprehension, and projection
In an EOC, situational awareness develops through three connected tasks: perceiving conditions, understanding their meaning, and projecting what may happen next. A map can show a hazard’s location, an incident report can explain its impact, and a forecast can help teams assess possible movement. Emergency operations center visualization supports this process when related sources appear clearly, with timestamps and context to help operators interpret changes.
Start with a defined operational question, then place the most relevant indicators together. Label each source, show when it was updated, distinguish reports from verified conditions, and use consistent map symbols. Keep the display focused on decisions operators must make, such as where impacts are growing and which resources may be affected.
Consider a hypothetical flood response. A GIS map shows rising water near a transportation corridor, while field reports describe closures and a weather feed tracks rainfall. Operators compare these signals, including their locations and update times, to understand the emerging impact. This gives them a clearer basis for deciding which developments need further assessment or escalation.
A common operating picture gives participating teams a shared reference, not a substitute for specialized analysis. Planning staff may need an incident map and current objectives, for example, while logistics staff need resource status and access constraints. Arrange views so each role can identify the information relevant to its work, then bring shared priorities into the common view. This keeps discussions grounded in consistent information while allowing each team to retain its operational detail.
Real-time data visualization also requires attention to freshness and source quality. A dashboard should make stale information visible rather than leaving operators to assume every feed is current. During a wildfire briefing, for instance, teams might compare a mapped perimeter, evacuation updates, and field observations. Showing when each observation was reported helps the group identify where the picture needs updating before assessing likely effects.
Projection is a structured assessment, not a claim of certainty. Teams can compare current conditions with trends, identify assumptions, and record what would change their assessment. In a storm scenario, an EOC might review the forecast alongside vulnerable locations and road status, then define indicators that would prompt a revised plan. Remote participants need access to the same essential view and update context so their input informs the same operational discussion.
For a practical review, test the display against a realistic exercise: Can operators locate the incident, identify the latest update, connect impacts to resources, and explain what they are watching next? Shared situational awareness displays offer one approach to organizing operational information for coordinated review.
Alerts, dashboards, and collaboration spaces
During a disaster, an alert matters only when its meaning and required response are clear. An EOC dashboard can group alerts by hazard, affected area, and operational priority. Each entry should identify its source, timestamp, status, and assigned follow-up. A road-closure alert, for example, could show the affected route beside a map and current resource assignments. Operators can then assess whether the closure affects access, evacuation activity, or planned deliveries. A preparedness exercise can test whether staff recognize the alert and know where to report its status.
Build alert handling around a consistent sequence: receive, assess, assign, and update. An incoming report first needs a source and location. Staff assess its relevance, route it to the responsible function, and record its disposition. A dashboard should distinguish new alerts from acknowledged items and unresolved issues. In a severe-weather scenario, a warning might prompt a planning review, while a verified road closure goes to the team coordinating transportation. Clear status labels help keep alerts from disappearing into an undifferentiated feed.
Scenario: A wildfire threatens communities near a highway. The EOC receives a field report about smoke and a separate notice about traffic restrictions. Staff compare locations, assess the reports, and assign follow-up to the relevant teams. The dashboard surfaces outstanding questions, including whether access routes remain usable. At the next briefing, the team reviews updated reports and changes the incident status as needed. This process connects alerts to decisions without treating every incoming message as equally urgent.
Collaboration spaces give teams a place to resolve those questions together. EOC video conferencing can connect remote teams, subject matter experts, and other agencies. A meeting view can pair the incident map with the current objectives and unresolved issues. For example, a county team discussing shelter capacity could invite a remote specialist and capture the agreed actions in shared notes. The value comes from keeping discussion tied to current information, with decisions and responsibilities visible to participants after the call.
Internal communication needs a separate, deliberate path. Intercom and paging systems can carry facility-wide announcements and alerts, while dashboards organize incident information for ongoing work. During a building evacuation exercise, a page can direct staff to the relevant procedure, while the dashboard tracks affected teams and operational updates. Keep announcements direct, identify who should act, and choose the appropriate channel. A routine status change does not require the same interruption as an urgent safety instruction.
Preparedness exercises can reveal whether these channels work as intended. Run a simulated incident, send alerts through their usual routes, and observe whether staff acknowledge, assign, and update them. Then review handoffs between the dashboard, conference discussion, and facility announcements. If a remote participant misses an update, adjust how the meeting shares status. If an alert remains unassigned, clarify ownership. These checks turn collaboration tools into a repeatable coordination process that can support real incident management.
EOC visualization for hazard assessment
Hazard assessment depends on connecting location, exposure, and operational impact. An EOC map can place an incident boundary beside roads, facilities, population areas, and response resources. Operators can then ask which assets fall within the affected area and which routes remain usable. The map supports assessment, but staff still interpret the information, weigh uncertainty, and decide what requires action. A useful view makes these relationships visible without hiding the source or status of each layer.
The Miami-Dade County Emergency Operations Center uses GIS-driven applications to support decision-makers and response teams. This illustrates how geographic information can inform operational review. A team assessing a developing hazard can compare mapped incident conditions with relevant local data, identify potential exposure, and determine where additional information is needed. The result is a clearer basis for prioritizing follow-up, assigning analysis, and briefing response partners.
For a practical hazard review, organize the map around a specific decision. First, identify the incident location and the area potentially affected. Next, add relevant layers, such as transportation routes, facilities, or resource locations. Then compare current observations with projected conditions and note where information is incomplete. This sequence helps analysts separate what the map shows from what the team infers. It also gives briefings a repeatable structure as the incident changes.
Scenario: A wildfire approaches a community as weather conditions shift. The EOC team displays the reported perimeter alongside nearby roads and critical facilities. Staff compare field updates with mapped exposure, flag routes that need review, and identify facilities requiring an updated status. The assessment directs questions to the appropriate teams. As new reports arrive, staff update the relevant layers and communicate changes through the shared operating picture.
Display design affects how quickly teams can interpret the operating picture. Size displays for the room, the information shown, and the number of operators who need to view them. Adapt brightness to ambient light, including changes between day and night. A dense regional map may need a broad shared view, while detailed analysis belongs on an operator’s workstation. Clear labels, restrained symbology, and visible update times help people distinguish layers and assess whether information is current.
Hazard assessment also needs continuity beyond the physical EOC. A virtual EOC can supplement an in-person facility, giving distributed teams a flexible workspace for incident information, communications, plans, and tasks. Map-based capabilities can help teams visualize incidents, risks, people, and assets. During a remote review, participants can examine the same mapped conditions and flag gaps for follow-up. Keep the assessment tied to the current mission, with clear ownership of updates and decisions.
After each exercise or incident, review how visualization shaped the assessment. Ask which map layers informed decisions, where conflicting updates created uncertainty, and what information arrived too late to affect the analysis. Use the findings to refine the map, update procedures, and clarify who maintains each layer. This makes hazard visualization a repeatable assessment process that connects geographic evidence with human judgment and coordinated response.
Emergency operations center visualization
Emergency operations center visualization tools differ in how they connect sources, organize information, and support decisions. Fragmented systems, information silos, and missing escalation can leave agencies with conflicting views. A video wall can show selected information, while dashboards and workstations support focused analysis. Compare systems by asking whether they connect relevant applications, clarify update status, and direct attention to operational priorities.
The technologies used include GIS applications, dashboards, video feeds, content management and distribution systems, conferencing, and individual displays. Each has a distinct role: GIS maps locations, dashboards organize status, and distribution systems route content to displays. A conference room can support agency briefings, while a workstation supports detailed analysis. The useful comparison is how well these tools work together, not how many features each one lists.
To set up a system, begin with the decisions the EOC must support. Identify the sources and roles involved, then map each source to the team or workspace that needs it. Define who can update information, how teams mark status, and what triggers escalation. Test the arrangement in an exercise. A simulated road closure, for example, can reveal whether staff can find the report, assess its effects, and share an updated view.
Common risks include stale data, disconnected applications, crowded displays, and alerts without clear ownership. In a wildfire exercise, an outdated perimeter shown beside current road information could mislead a briefing. Assign responsibility for maintaining each source, display update times, and separate new reports from assessed conditions. Then test a handoff between teams. If an alert remains unassigned or a map conflicts with a report, revise the workflow and repeat the scenario.
In the United States, the National Incident Management System provides a nationwide approach for coordinating preparedness, response, and recovery. It offers a coordination framework, while local EOC platforms and applications support operational work. The Los Angeles EOC organizes its Emergency Support Function layout according to ICS Branch and Federal Emergency Support Functions. The Miami-Dade County EOC uses GIS-driven applications to support decision-makers and response teams. These examples show how agencies can align visualization with roles and mission needs.
For a practical design review, trace an incident update from its source through analysis, assignment, briefing, and display. Confirm that each handoff preserves context and ownership. Assess EOC information flow against the decisions teams must make.
Activu Corporation: Video Wall Systems
Activu Corporation helps EOCs address fragmented applications, information silos, and missed escalation through integrated operational awareness. Most control rooms already have screens. What they need is a way to determine what appears on them and automatically escalate information that needs attention.
The vis/ability Platform provides application integration and event-driven situational awareness through a central hub. This operational intelligence layer brings relevant information to video walls and directs it to teams in command centers, remote locations, conference rooms, breakout rooms, huddle rooms, and on mobile devices. Video Wall Systems provide shared displays for that prioritized operational picture.
Contact Activu Corporation to discuss how its capabilities can support your EOC’s operational needs.
Prepare the operating picture for the next decision
Make your next step a practical review of how information reaches decision-makers. Choose a realistic exercise, identify the decisions teams must make, and trace how relevant updates move through the EOC. Note where ownership becomes unclear, escalation stalls, or staff need a shared view. This turns emergency operations center visualization from a display plan into an operational capability shaped around your teams’ actual workflows.
Activu Corporation offers Video Wall Systems, the vis/ability Platform, and Event-Driven Situational Awareness. Together, these offerings help integrate, prioritize, and present operational information for team awareness. Start with the gap your exercise reveals, whether teams need clearer information flow or a more coordinated operating picture.
Use that finding to guide the next conversation about your EOC’s requirements and workflows. Contact Activu Corporation to discuss your operational needs. A deliberate review can help your team move toward clearer decisions and stronger coordination.
Frequently Asked Questions
What is an emergency operations center visualization?
It organizes incident information so teams can interpret operational conditions and coordinate decisions. Emergency operations center visualization can combine maps, status indicators, reports, and communication tools in a shared interface. During a power outage, for example, staff could compare affected areas with facility status and incoming support requests. The display makes connections visible while leaving teams responsible for assessing reports and choosing actions.
What information should an emergency operations center dashboard display?
Show information that helps staff understand the incident and their next actions: incident name and location, current status, affected areas, operational objectives, resource needs, open tasks, and responsible teams. Include each item’s source and latest update so users can judge its relevance. A shelter dashboard, for example, could show facility status, capacity updates, unresolved supply requests, and the team assigned to each follow-up.
How can emergency operations centers visualize real-time maps, incidents, resources, and alerts?
Use GIS views to locate incidents and assets, then add operational layers that help staff assess how they relate. Filters can focus a user on a hazard area, resource type, or incident status. Selecting a map feature can reveal its associated report or task. In emergency operations center visualization, an operator reviewing a road incident could examine nearby response assets and open alerts without leaving the mapped area.
What accessibility, security, and interoperability standards apply to emergency operations center dashboards?
For U.S. EOCs, NIMS calls for communications and information management systems to account for interoperability and redundancy. Dashboard teams should also apply their organization’s accessibility and security requirements. Practical design includes readable text, clear contrast, labels that don’t rely on color alone, and keyboard access. Security planning should define user permissions and protect sensitive information. Document how systems exchange data and what staff should use if a connection fails.