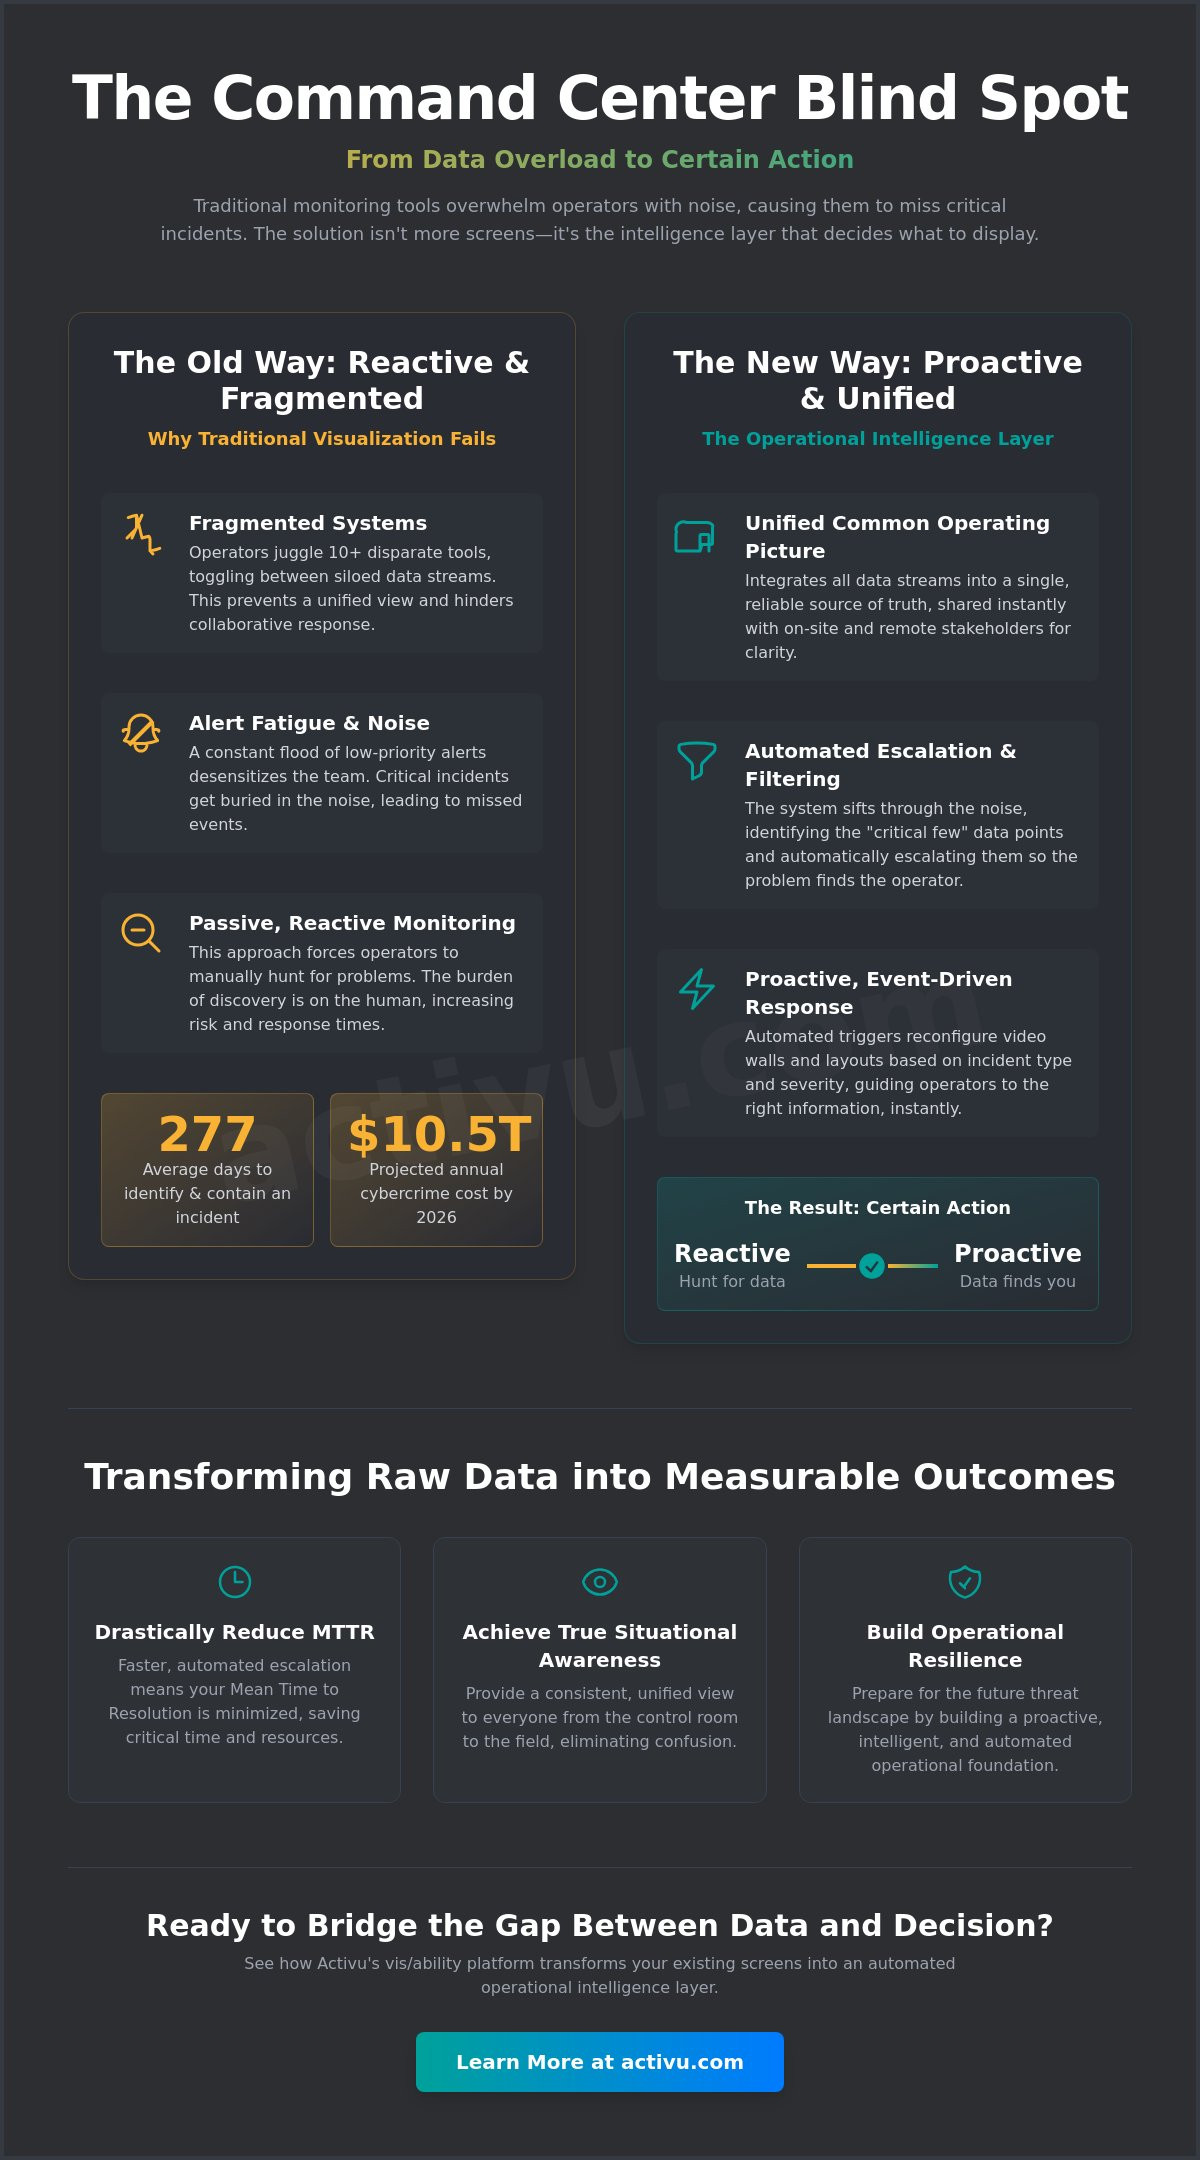
Why do your operators keep missing critical incidents despite having dozens of screens and dashboards? The core challenge lies in the cognitive overload caused by too many disparate tools rather than a lack of information. Organizations now take an average of 277 days to identify and contain security incidents, a delay that is unacceptable when global cybercrime costs are projected to reach $10.5 trillion in 2026. Traditional data visualization for incident response often fails because it relies on static views that bury critical alerts in noise. You likely feel the pressure of fragmented systems that make it difficult to share a unified view with remote stakeholders. Most control rooms already have the screens. What they’re missing is the layer that decides what goes on them, and escalates automatically when something needs attention.
Learn how to transform these fragmented data streams into an automated operational intelligence layer. This article explores how vis/ability moves beyond basic charts to create a single, reliable common operating picture. We will examine how automated escalation and real-time visualization reduce your mean time to resolution and ensure your team maintains situational awareness, whether they’re in the command center, a huddle room, or using mobile devices. By the end, you’ll understand how to bridge the gap between raw data and certain action.
Key Takeaways
- Most control rooms already have the screens. What they’re missing is the layer that decides what goes on them, and escalates automatically when something needs attention.
- Learn to transform data visualization for incident response from a collection of static charts into an automated operational intelligence layer that filters out noise.
- Unify fragmented feeds from specialized tools into a single common operating picture with vis/ability, ensuring clarity for both on-site and remote stakeholders.
- Identify the “critical few” data points that drive immediate action and map automated triggers to specific incident types for faster response times.
- Transition from reactive monitoring to proactive intelligence to build the operational resilience required for the high-stakes 2026 threat landscape.
Why Traditional Data Visualization Fails in Incident Response
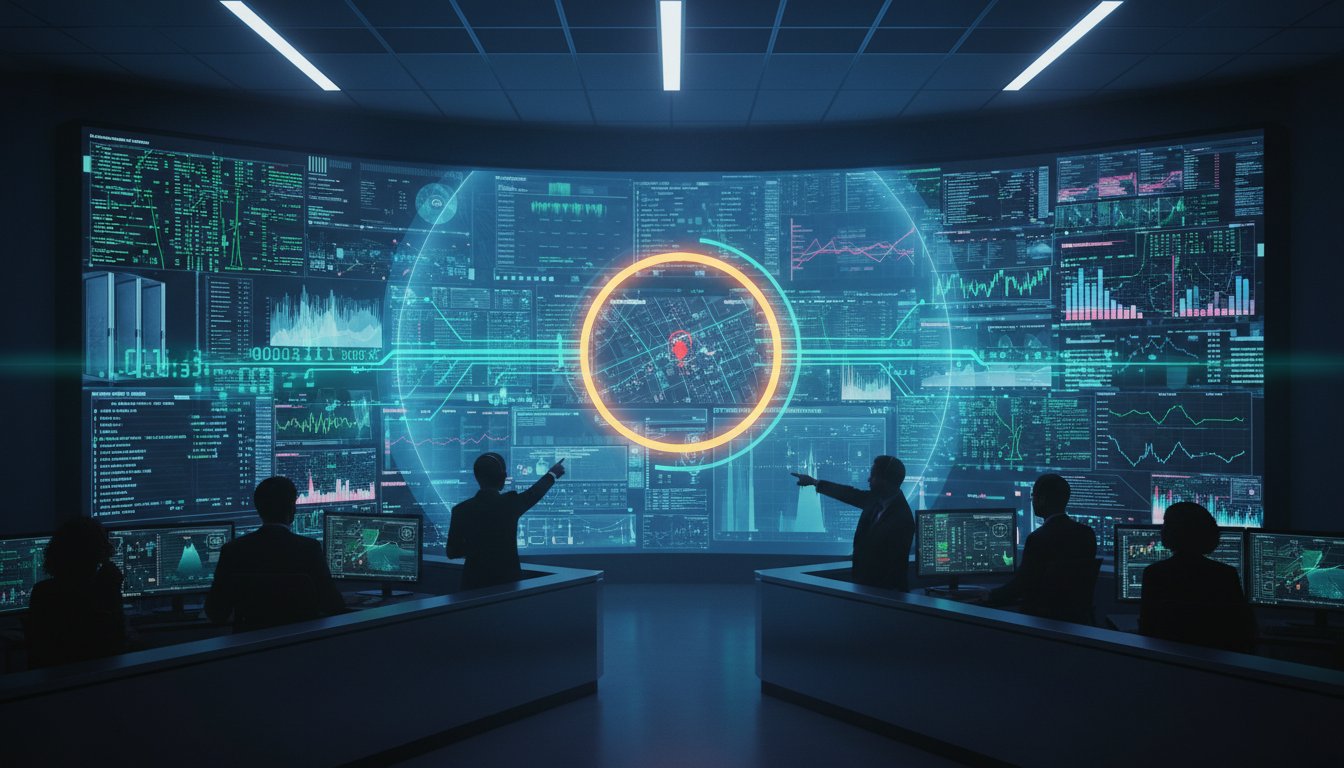
In a high-stakes control room, data visualization for incident response is the foundation of every mission-critical decision. It serves as the essential bridge between raw telemetry and human judgment. When an incident occurs, operators don’t need more data; they need clarity. Most traditional systems fail because they treat visualization as a passive display for retrospective analysis rather than a tool for active crisis management. While a static dashboard might work for reviewing monthly uptime, it’s insufficient when seconds matter during a physical breach or a grid failure.
Operators frequently find themselves overwhelmed, managing ten or more disparate browser tabs while toggling between video management systems, geospatial maps, and network monitors. This fragmented environment creates intense cognitive overload. When critical information is spread across multiple disconnected screens, the most vital anomalies often disappear into the background noise. This passive monitoring approach forces operators to go hunting for problems, which inevitably leads to slower response times and increased risk. Real situational awareness requires the problem to find the operator, not the other way around.
The Reality of Alert Fatigue in the SOC and NOC
Constant visual stimuli from low-priority alerts create a dangerous state of desensitization. In many SOC and NOC environments, the instinct is to add more screens to solve the visibility gap. However, increasing the number of displays often leads to slower response times because it expands the surface area an operator must scan. This environment fosters cognitive tunneling, a psychological state where an individual’s focus narrows so intensely on a single task or alert that they lose awareness of other critical events occurring simultaneously. In a high-pressure environment, this narrowing of vision can be catastrophic.
Siloed Data: The Enemy of Situational Awareness
Fragmented information is the primary obstacle to a true Common Operating Picture (COP). Tools like Security Information and Event Management (SIEM) or specialized platforms like Axon provide valuable data, but they often operate in isolation. They offer only a partial view of the total incident landscape. If your network security team sees a spike in traffic while your physical security team sees an unauthorized entry, but neither can see the other’s data, your organization is blind to the full scope of the threat.
This siloed approach prevents a unified response and causes a breakdown in communication between the control room and field units. Without a central hub to aggregate these feeds, the “truth” remains scattered across the organization. Most control rooms already have the screens. What they’re missing is the layer that decides what goes on them, and escalates automatically when something needs attention. By moving beyond static views, teams can finally achieve the visibility into what matters most, transforming raw data into certain action.
The Operational Intelligence Layer: Beyond Static Screens
The operational intelligence layer is the missing link in modern command centers. Most control rooms already have the screens. What they’re missing is the layer that decides what goes on them, and escalates automatically when something needs attention. This technology does not replace your existing security or monitoring tools. Instead, it serves as the unifying hub into which all other data streams flow. By implementing an event-driven approach to data visualization for incident response, organizations shift the cognitive burden away from the operator. The system takes over the task of sifting through noise, ensuring that only mission-critical information reaches the human decision-maker at the right moment.
Automation plays a decisive role in this transition. In a traditional setup, an operator might miss a critical breach because they were monitoring a different feed or analyzing a low-priority alert. An operational intelligence layer changes this dynamic by automatically reconfiguring video walls and workstation layouts based on incident severity levels. When a high-priority event is detected, the system orchestrates the visual environment to force the relevant data into view. This proactive orchestration ensures that critical intel is never hidden behind a minimized window or buried on a secondary screen. It reduces the time spent navigating software and increases the time spent making life-saving or infrastructure-critical decisions.
Automating the Escalation of Visibility
The core of this strategy is the difference between looking for a problem and being shown the solution. When a specific trigger occurs, such as a cybersecurity anomaly or a physical security breach, vis/ability initiates a pre-defined visual response. This immediate escalation provides instant situational awareness without requiring manual intervention. It allows teams to act with greater certainty because the system has already performed the initial triage of visual data. You can speak with our design team to see how these automated triggers can be customized for your specific operational needs.
Unified Command Across Distributed Teams
Operational clarity shouldn’t be confined to the physical walls of a command center. The intelligence layer extends this “single source of truth” to stakeholders in huddle rooms or those using mobile devices in the field. By utilizing the vis/ability Platform, every team member sees the same real-time visualization regardless of their location. This seamless integration ensures that remote decision-makers have the same level of intelligence as those on the floor. It eliminates the communication gaps that often occur during fast-moving crises, providing the bedrock upon which coordinated decisions are made. This unified operating picture is what enables a truly resilient response across the entire organization.
Integrating Fragmented Feeds into a Unified Operating Picture
Tool sprawl is a pervasive challenge in modern command centers. Operators often find themselves surrounded by specialized software designed for specific tasks. While tools like Axon or various SIEM platforms provide deep technical insights, they only offer a partial view of an unfolding incident. They are data sources, not a complete solution. Effective data visualization for incident response requires these disparate feeds to be aggregated into a single, cohesive interface. Without this unification, the burden of correlating information falls entirely on the operator. This leads to critical delays during high-stakes moments when every second counts.
Most control rooms already have the screens. What they’re missing is the layer that decides what goes on them, and escalates automatically when something needs attention. This is where a truly integrated operating picture becomes essential. By centralizing visualization, you eliminate the need for operators to toggle between ten different browser tabs or specialized applications. This orchestration ensures that the right data is always front and center, regardless of which tool generated it. It transforms a room full of monitors into a proactive intelligence center.
The Shortcomings of Standalone Incident Tools
Standalone tools are powerful within their specific domains. Some organizations rely on them for geospatial mapping or network telemetry. However, these systems are often siloed. Switching between specialized security software and separate map layers wastes valuable time and fractures situational awareness. This friction creates a gap in the response chain. To bridge this, a framework for incident management must prioritize the seamless flow of data between systems. Relying on a patchwork of tools without a unifying layer leaves your team vulnerable to the noise that hides critical anomalies.
Orchestrating Diverse Data Streams
True coordination requires more than just looking at a screen. You must integrate live video feeds with real-time data analytics and geospatial information. This requires a platform that acts as the glue for your existing mission-critical systems. By utilizing Commercial Off-The-Shelf (COTS) flexibility, vis/ability integrates with your current infrastructure. This application integration creates a workflow where VMS, network data, and analytics move as one. The result is a unified operating picture that allows your team to act with greater certainty. You can contact our specialists to learn how to integrate your specific data feeds into a streamlined operational layer. This approach provides the visibility into what matters most, ensuring your team remains focused and analytical when stakes are at their highest.
Designing Your Visualization Strategy for Maximum Clarity
Strategy turns a collection of monitors into a coordinated response tool. Without a clear framework, even the most advanced data visualization for incident response becomes a liability. Most control rooms already have the screens. What they’re missing is the layer that decides what goes on them, and escalates automatically when something needs attention. Building this layer requires a methodical approach that prioritizes human decision-making over raw data volume. Your goal is to ensure that when an incident occurs, the system provides the path to resolution rather than a wall of noise.
The first step is to identify the “Critical Few” data points. These are the specific metrics or feeds that drive immediate, non-negotiable action, such as a localized fire alarm, a power grid failure, or a Tier 1 cybersecurity breach. Once these are identified, you must map automated triggers to these incident types. This ensures that the system reconfigures the visual environment the moment a threshold is crossed. Finally, you must test and refine these layouts through regular drills. Operator feedback during simulated crises is the only way to verify that your visual strategy holds up under the pressure of real-world operations.
Visual Hierarchy in the Control Room
Effective visualization relies on a strict hierarchy. Use color and size to signal urgency. A red border or a maximized window should only be used for events that require immediate intervention, preventing the desensitization that comes from overusing high-priority visual cues. We follow the at-a-glance rule: an operator should be able to understand the status of a situation within three seconds of looking at the screen. Eliminating non-essential data during a crisis is the most effective way to protect the operator’s cognitive bandwidth and ensure they remain focused on the mission. You can consult with our specialists to design a visual hierarchy tailored to your specific facility.
Mobile Integration and Field Collaboration
Situational awareness is incomplete if it’s trapped within the physical walls of the command center. A truly unified operating picture must extend to every stakeholder, regardless of their location. By establishing a mobile-first protocol, you ensure that field responders and remote executives have access to the same visual context as the headquarters. This is achieved through Activu Link, which allows for the secure sharing of real-time visuals across any device. Providing field units with this level of intelligence eliminates the ambiguity of verbal descriptions and allows for a coordinated, certain response. When everyone sees the same “truth,” the time between detection and resolution drops significantly.
Securing the Future of Mission-Critical Operations
The landscape of incident response is undergoing a fundamental shift from reactive monitoring to proactive intelligence. In 2026, operational resilience is no longer just a goal; it’s a regulatory requirement. New mandates like the Cyber Incident Reporting for Critical Infrastructure Act (CIRCIA) and the EU Cyber Resilience Act (CRA) require organizations to report significant incidents within 24 to 72 hours. Meeting these strict timelines is impossible with fragmented data and manual processes. This is why the operational intelligence layer has become a requirement for modern resilience. By implementing advanced data visualization for incident response, teams can move from a state of constant firefighting to a state of controlled, proactive defense.
Most control rooms already have the screens. What they’re missing is the layer that decides what goes on them, and escalates automatically when something needs attention. This transition allows the organization to focus on high-level strategy rather than technical troubleshooting. It ensures that the bedrock of your operation remains stable even when global cybercrime costs are projected to reach $10.5 trillion. By automating the flow of information, you empower your personnel to act with greater certainty when the stakes are at their highest. This approach provides the visibility into what matters most, ensuring that critical decisions are based on clarity rather than chaos.
Human-Centric Design in Digital Spaces
Technology should never replace human judgment. Instead, it should empower it. The role of Activu is to humanize complex data streams, translating raw telemetry into actionable intelligence. We believe that software serves as the essential bridge between digital information and human decision-making. By reducing the noise and highlighting what matters most, our platform allows operators to maintain their focus and analytical capabilities. This human-centric approach is vital for successful mission-critical operations, where the quality of a decision can have life-saving or infrastructure-critical consequences.
Taking the Next Step Toward Visibility
Achieving a true common operating picture begins with an honest assessment of your current environment. Many organizations realize that their control room situational awareness problems stem from a lack of integration rather than a lack of data. Assessing your visualization gaps is the first step toward building a more resilient operation. Professional control room design services can help optimize your physical and digital space, ensuring that your team has the visibility needed to succeed.
Moving from fragmented screens to a unified command requires a partner who understands the high-stakes reality of your mission. We provide the technical reliability and expertise needed to transform your operations from the ground up. To build a single, reliable common operating picture that drives faster and more accurate responses, contact Activu today.
Establishing a Unified Command and Control
Transitioning from passive monitoring to proactive intelligence is the only viable path to operational resilience. By implementing an automated layer, you eliminate the cognitive overload that causes operators to miss critical incidents. This approach ensures that your team maintains visibility into what matters most, regardless of the complexity of the threat landscape. Most control rooms already have the screens. What they’re missing is the layer that decides what goes on them, and escalates automatically when something needs attention.
Effective data visualization for incident response requires more than just better charts; it requires the secure integration of COTS and legacy systems into a single common operating picture. Our event-driven automation is designed to reduce mean time to resolution, providing the bedrock for life-saving decisions. This technology is already trusted by top-tier GSOCs, NOCs, and EOCs nationwide to maintain clarity amidst potential chaos. You have the power to transform your fragmented feeds into a decisive advantage and lead your team with absolute certainty.
Request a Demo of the vis/ability Platform
Frequently Asked Questions
What is the difference between a dashboard and an operational intelligence layer?
A dashboard is a passive display used for retrospective data analysis. An operational intelligence layer is an active, event-driven system that orchestrates visual data in real-time. While dashboards require manual monitoring, the layer automates what is shown based on incident severity. It ensures that the most critical information is prioritized without operator intervention, turning a static display into a proactive tool.
How does data visualization reduce operator fatigue during an incident?
Effective data visualization for incident response reduces fatigue by filtering out noise and presenting only the “critical few” data points. By automating the visual environment, the system prevents cognitive overload and the need to scan dozens of monitors. This allows operators to maintain focus and make high-stakes decisions with greater clarity and less mental exhaustion during a crisis.
Can we integrate our existing SIEM and VMS into a unified video wall?
Yes, the vis/ability platform is designed to integrate with your existing SIEM, VMS, and other mission-critical tools. It acts as the unifying hub that aggregates fragmented data into a single common operating picture. This integration eliminates tool sprawl and ensures that disparate feeds work together to provide a comprehensive view of any unfolding incident without requiring a hardware overhaul.
Why do operators miss critical incidents when using multiple monitors?
Operators miss incidents primarily due to cognitive tunneling and the overwhelming volume of visual stimuli across disconnected screens. When data is siloed in separate tabs or monitors, the brain struggles to correlate information in real-time. Most control rooms already have the screens. What they’re missing is the layer that decides what goes on them, and escalates automatically when something needs attention.
How does vis/ability handle automated escalation for incident response?
The system utilizes event-driven triggers to automatically change video wall layouts and workstation views when a specific threshold is met. For example, a fire alarm or a security breach can instantly push relevant camera feeds and maps to the forefront. This proactive escalation ensures that critical intel is never hidden behind a minimized window or buried in background noise during a Tier 1 event.
What are the benefits of extending a common operating picture to mobile users?
Mobile extension ensures that field responders and remote stakeholders see the same “truth” as the command center. This synchronization eliminates communication gaps and allows for coordinated action across distributed teams. By providing real-time visual context to mobile devices, organizations can reduce mean time to resolution and ensure that every decision-maker has the same situational awareness regardless of their location.
Is it possible to implement event-driven visualization with legacy systems?
Yes, our platform uses application integration to bridge the gap between modern software and legacy infrastructure. We specialize in making existing tools more useful by providing the operational intelligence layer they currently lack. This approach protects your previous investments while modernizing your response capabilities to meet current resilience requirements and strict regulatory reporting timelines.
How does a common operating picture improve inter-agency collaboration?
A common operating picture provides a single, reliable source of information that all agencies can trust and act upon simultaneously. It removes the ambiguity of verbal reports and ensures that everyone, from local police to federal agencies, has the same visual context. This unified view is essential for coordinating responses during large-scale emergencies or infrastructure-critical events where seconds matter.