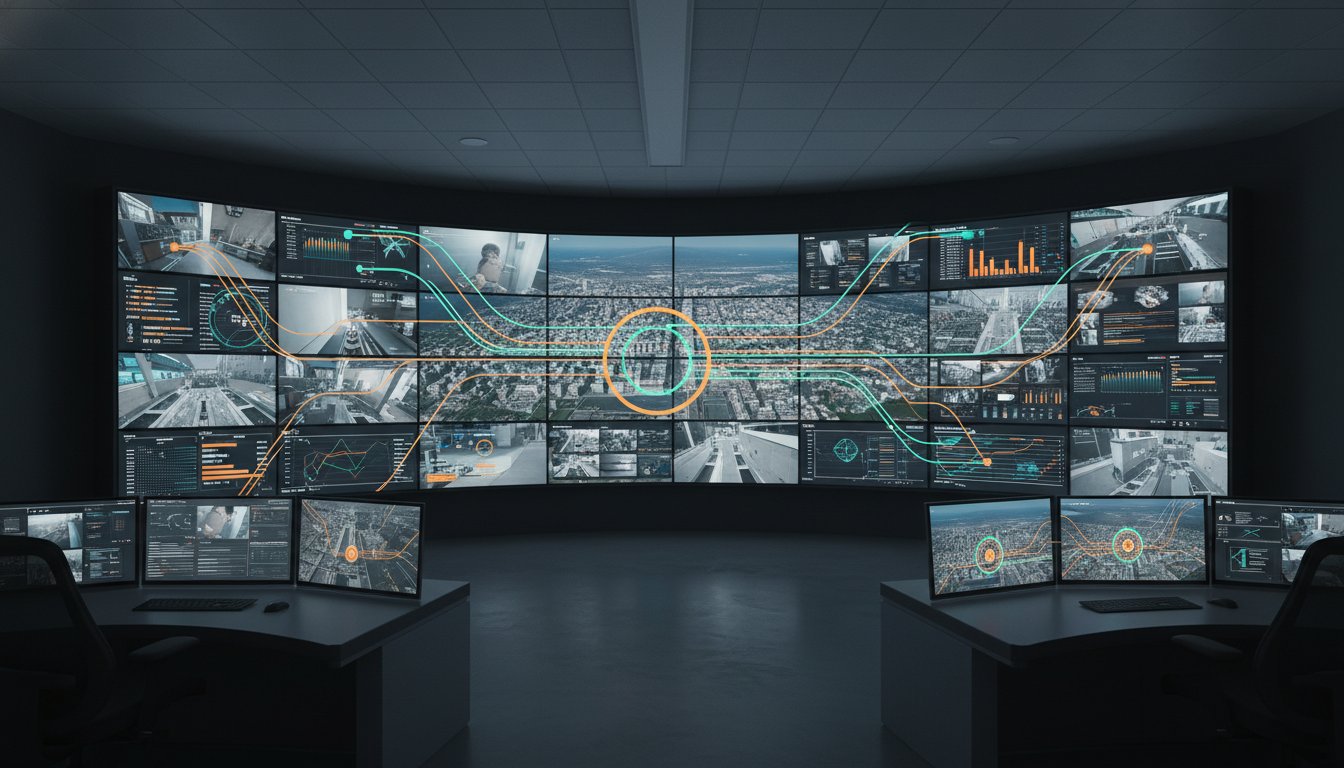
The most sophisticated command center is only as effective as the operator’s ability to see a threat before it escalates. Today, that ability is often buried under data silos where VMS feeds, telematics, and cybersecurity alerts remain trapped in separate systems. When an incident occurs, operators face cognitive overload. Adopting an event-driven visualization platform changes this dynamic by shifting the focus from manual monitoring to intelligent, automated response.
Most control rooms already have the screens. What they’re missing is the layer that decides what goes on them, and escalates automatically when something needs attention. Specialized tools like Axon provide critical data but only offer a partial solution; they often fail to unify disparate systems into a single common operating picture. True situational awareness requires an operational intelligence layer that integrates these tools into a cohesive view. We’ll explore how the vis/ability platform orchestrates this data, enabling automated escalation and significantly reducing response times during mission-critical operations.
Key Takeaways
- Learn how to eliminate data silos and cognitive overload by transforming fragmented feeds into a cohesive, actionable stream of intelligence.
- Discover why an event-driven visualization platform is the essential operational intelligence layer that automates data escalation for high-stress environments.
- Compare the efficiency of proactive workflows against static, manual processes to see how information can find your operators exactly when it matters most.
- Identify the steps to integrate legacy systems with modern tools, creating a unified common operating picture accessible in the command center or on mobile.
The Crisis of Fragmented Data in Mission-Critical Operations
The efficiency of a command center is frequently undermined by the very systems designed to protect it. Fragmented data sources, ranging from disparate Video Management Systems (VMS) to isolated cybersecurity alerts, create a fractured operational environment. When critical information is siloed, the burden of correlation falls entirely on the human operator. This manual process, often called the “swivel-chair” problem, requires personnel to jump between workstations and applications to piece together a coherent story. During a high-stress incident, this friction isn’t just a nuisance; it’s a primary driver of response failure.
Siloed Intelligence and Response Delays
The gap between collecting raw data and generating actionable intelligence is where mission-critical operations often falter. In a multi-agency response, information noise becomes a significant barrier to clarity. Every second spent navigating between disconnected tools like incident management software and live sensor feeds is a second lost in the decision-making cycle. Without an event-driven visualization platform, there’s no automated mechanism to prioritize what matters. Operators are left to filter through thousands of non-critical data points, hoping they identify the one trigger that signifies a genuine emergency. This reliance on manual detection ensures that response times remains reactive rather than proactive.
The Limits of Traditional Video Wall Monitoring
There’s a common misconception that more screens lead to better visibility. In reality, an overabundance of displays often results in less situational awareness for the team. Static video walls, while impressive in scale, are frequently filled with “dead” data that doesn’t change or require action. This leads to cognitive fatigue, which is the quantifiable decline in an operator’s ability to process visual information after prolonged exposure to monotonous or cluttered displays. In a 24/7 operation, the human brain isn’t wired to maintain peak focus on a grid of dozens of static camera feeds.
When an incident occurs, the relevant data is often hidden in plain sight, obscured by the surrounding noise. Most control rooms already have the screens. What they’re missing is the layer that decides what goes on them, and escalates automatically when something needs attention. Transitioning to an event-driven visualization platform removes the guesswork. It ensures that the video wall serves as a dynamic asset that adapts to the operational reality on the ground, rather than a static backdrop that contributes to operator burnout.
What is an Event-Driven Visualization Platform?
An event-driven visualization platform represents a fundamental shift in how command centers process and act upon information. It’s not a simple display tool; it functions as an operational intelligence layer that bridges the gap between raw data and human decision-making. Most control rooms already have the screens. What they’re missing is the layer that decides what goes on them, and escalates automatically when something needs attention. By serving as the central hub for all disparate data streams, this platform ensures that the right information reaches the right person at the exact moment it becomes critical.
This technology moves beyond the limitations of manual monitoring. It correlates data from diverse sources such as SCADA systems, weather sensors, and cybersecurity logs, transforming them into a unified visual narrative. Instead of operators hunting for insights across multiple monitors, the platform uses automated triggers to surface the most relevant data. This proactive approach allows the team to maintain a constant state of readiness, regardless of the complexity or volume of the incoming data feeds.
The Operational Intelligence Layer Explained
Standard video wall controllers are built to manage pixels and layouts. They focus on where a window sits on a screen but lack the context of what that window actually contains. In contrast, the operational intelligence layer understands the data within the application. It integrates geospatial coordinates, live video feeds, and complex enterprise application data into a single, cohesive environment. This layer sits between your data sources and your displays, acting as an intelligent filter. It prevents information overload by ensuring the team sees only what is relevant to the current mission, effectively turning the video wall into a proactive asset rather than a passive monitor.
How Event Triggers Drive the Common Operating Picture
The power of this platform lies in its ability to respond to specific event triggers. In an operational context, an “event” is any significant change in state, such as a sensor alert, a geofence breach, or a sudden spike in network traffic. Traditional workflows rely on an operator to notice these changes manually, a process prone to error and delay. With the vis/ability platform, these events trigger automatic escalation logic. When a pre-defined threshold is met, the system moves the relevant data from the background directly to the focal point of the display. This logic ensures that the common operating picture is always aligned with the most urgent operational needs, allowing for immediate intervention. If your team needs to improve coordination across distributed sites, exploring integrated control room solutions can help bridge those operational gaps.
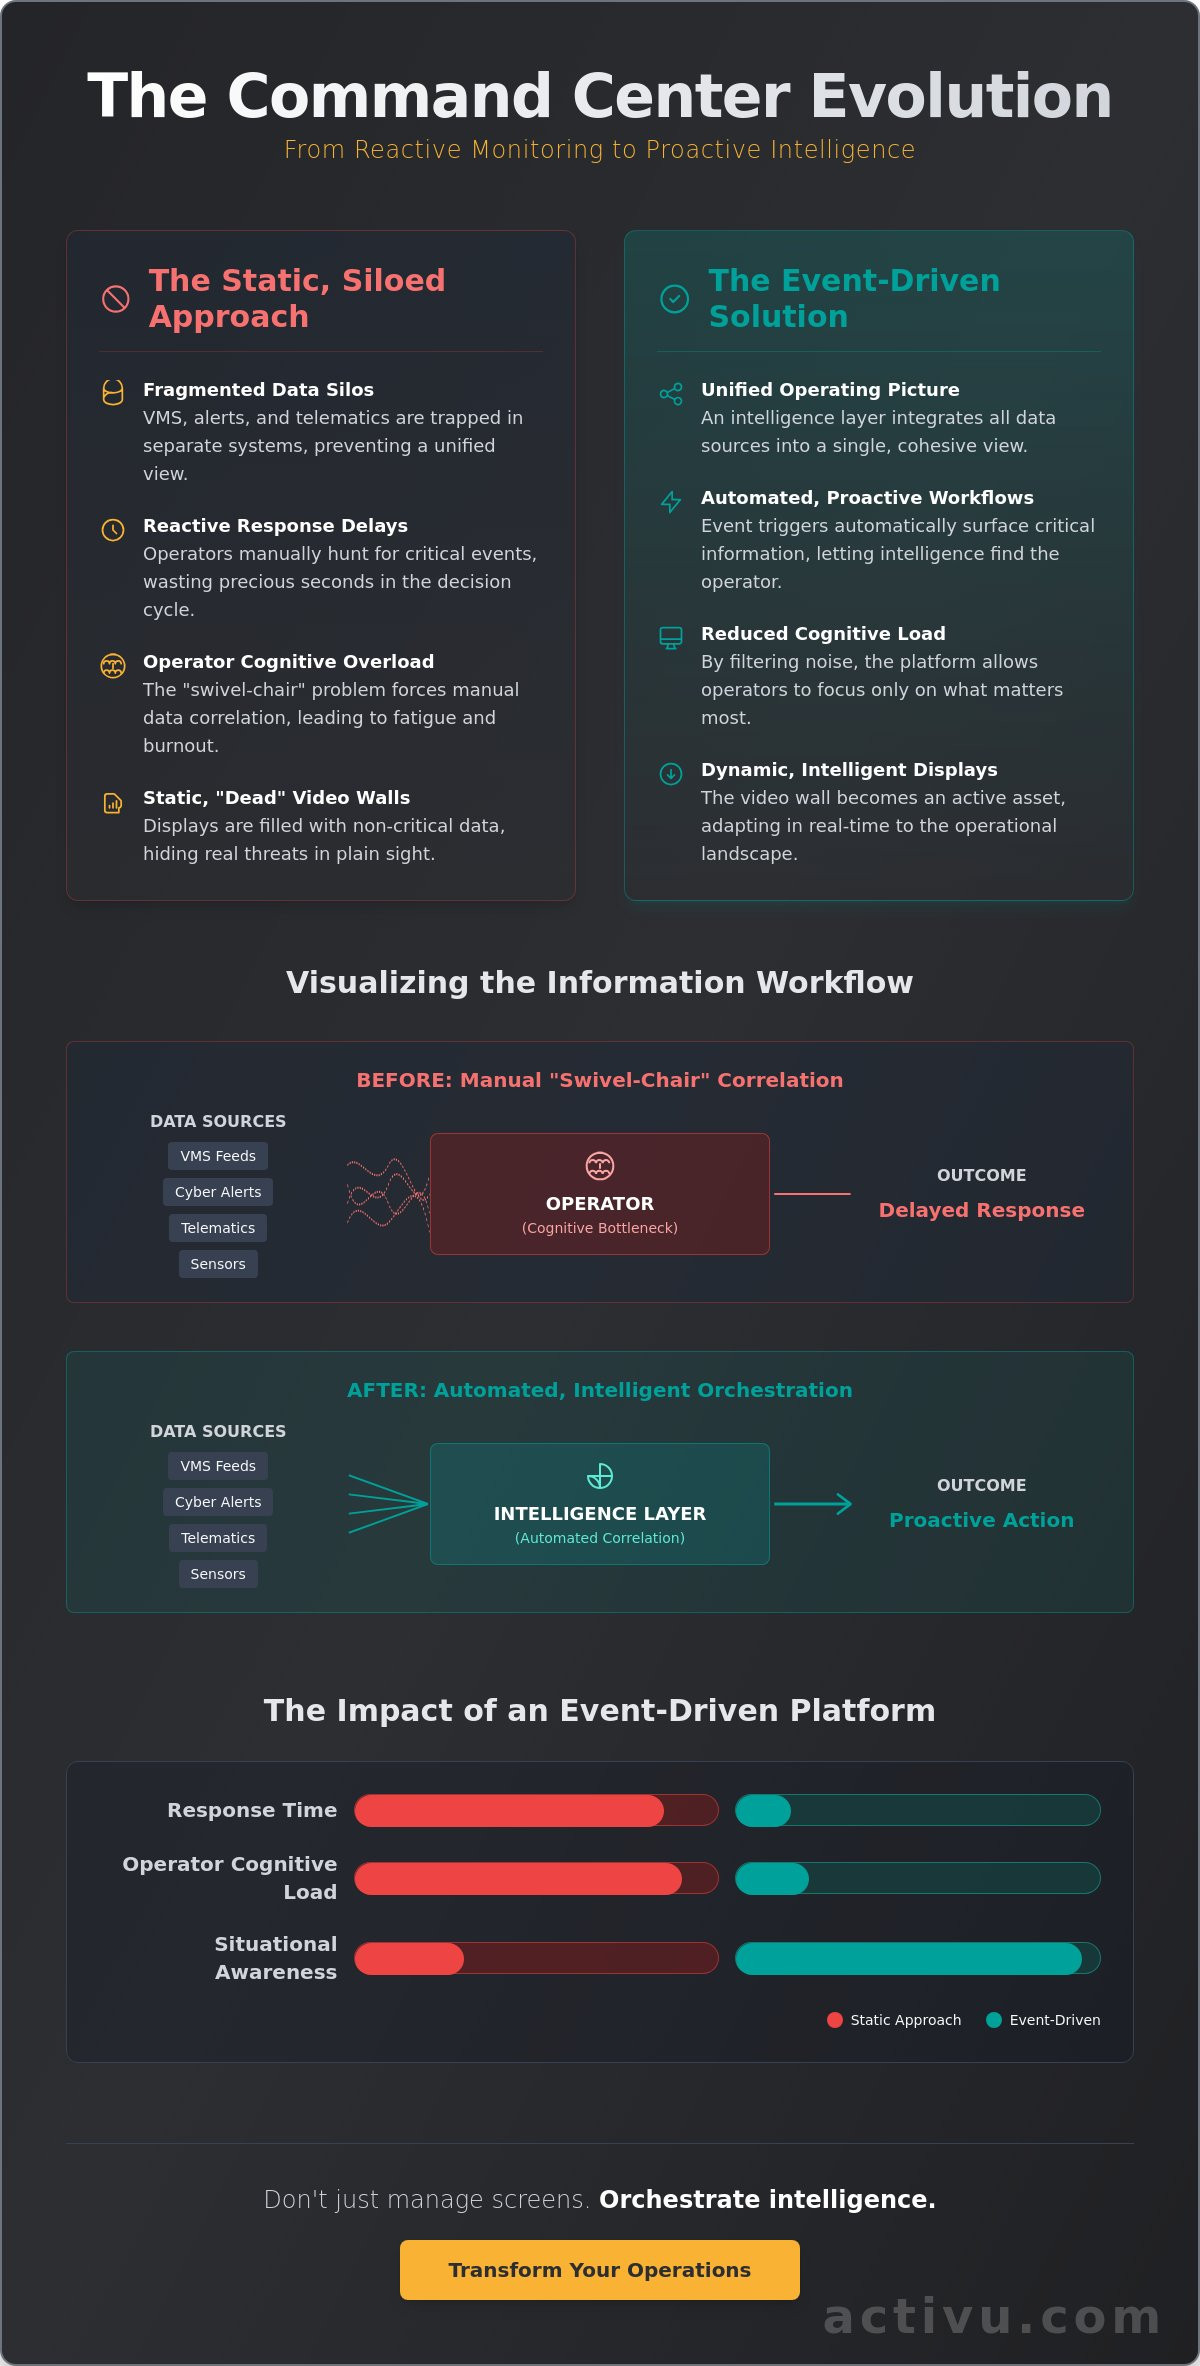
Comparing Static vs. Event-Driven Operational Workflows
Traditional static workflows rely on an operator’s ability to monitor a wall of information and manually correlate events. This is a reactive posture. It creates a bottleneck where the human is the primary processor of raw data. Most control rooms already have the screens. What they’re missing is the layer that decides what goes on them, and escalates automatically when something needs attention. By implementing an event-driven visualization platform, the dynamic shifts. Information finds the operator when it matters most, reducing the friction of manual data retrieval.
Quantifying success in a command center requires looking at Mean Time to Detect (MTTD) and Mean Time to Respond (MTTR). In a static environment, MTTD is high because it depends on human observation. Event-driven workflows automate this detection. When a sensor triggers, the relevant visual context is pushed to the forefront. This speed directly translates to a lower MTTR, allowing teams to resolve incidents before they spiral into disasters. This transition also empowers collaboration. Whether the team is in the main command center, a distributed huddle room, or using mobile devices, they all see the same critical intelligence simultaneously.
The Shortcomings of Partial Solutions
Some organizations use specialized tools like Axon or proprietary VMS platforms to manage specific data types. While these tools are effective for their intended use, they are inherently siloed. They provide a partial solution but lack the capability to create a full common operating picture for the entire team. These COTS solutions require a unifying layer to be truly effective. Without the vis/ability platform acting as the central hub, operators are still forced to manually bridge the gap between these disconnected systems during a crisis.
Efficiency Gains in High-Stakes Environments
The benefits of automation become clear during crisis peaks. In public safety, a sudden influx of 911 calls can overwhelm a dispatch center. An event-driven visualization platform automatically adjusts screen layouts to show the most relevant camera feeds and GIS data based on the call locations. Similarly, in utilities, a grid failure can trigger hundreds of alarms. Automated escalation ensures that only the critical fault data is prioritized on the video wall. This prevents the team from being buried under a mountain of non-essential alerts, maintaining clarity when the stakes are at their highest.
Implementing the Intelligence Layer in Your Control Room
Deploying an event-driven visualization platform requires a methodical assessment of the existing operational environment. It’s about the data. A successful implementation begins by auditing the health of your network and the reliability of your data feeds. Most control rooms already have the screens. What they’re missing is the layer that decides what goes on them, and escalates automatically when something needs attention. This intelligence layer must act as the bridge between legacy hardware and modern software, ensuring that your investment in physical infrastructure isn’t wasted by outdated data management processes.
Securing the common operating picture is non-negotiable. As systems become more networked, the intelligence layer must adhere to federal-grade encryption and access control standards. This ensures that while data is visible and actionable, it remains protected from unauthorized access or external threats. Integrating these security protocols from the start allows the team to act with certainty, knowing the information on their displays is both accurate and secure.
Mapping Your Operational Reality
Identifying the specific reasons why operators miss incidents is the first step toward building a more resilient operation. You must determine which data feeds are mission-critical and which are secondary. For example, a fire alarm in a high-voltage area requires immediate escalation, while a routine maintenance log can remain in the background. Establishing these parameters is essential for mission-critical resilience. By mapping these triggers early, you ensure the platform prioritizes the events that truly impact safety and continuity.
Integration Strategy for Unified Visibility
Modern NOC and SOC environments require deep application integration to function effectively. The goal is to scale from a single video wall to a distributed enterprise network where every huddle room and mobile device shares the same intelligence. For utility environments, maintaining NERC CIP compliance is a core requirement during this integration. An event-driven visualization platform should simplify compliance by providing clear audit trails of what was displayed and when. If you’re ready to modernize your command center, consult with our control room design experts to begin your integration strategy.
vis/ability: The Hub for Mission-Critical Situational Awareness
Activu’s vis/ability platform serves as the bedrock for decision-making in the world’s most demanding environments. It transforms the event-driven visualization platform from a technical concept into a powerful operational reality. Most control rooms already have the screens. What they’re missing is the layer that decides what goes on them, and escalates automatically when something needs attention. By providing this intelligence layer, vis/ability allows organizations to move away from reactive firefighting. It establishes a proactive management style where data is orchestrated with absolute technical reliability.
Operational clarity shouldn’t stop at the command center door. A true common operating picture must extend to distributed teams and mobile users to be effective. Whether personnel are collaborating in a huddle room or responding from the field, they require the same high-fidelity intelligence as the operators at the main video wall. vis/ability ensures this continuity by synchronizing critical data across the entire enterprise network. This mobile extension bridges the gap between headquarters and the front lines, ensuring every stakeholder has visibility into what matters, regardless of their physical location.
Technology is most effective when it empowers human judgment rather than replacing it. By automating the delivery of relevant data, the platform eliminates the manual struggle of data correlation. This allows your team to act with greater certainty when stakes are at their highest. It humanizes the digital space by ensuring that the people responsible for infrastructure-critical decisions aren’t overwhelmed by information noise. Instead, they’re supported by a steady, reliable stream of actionable intelligence.
Visibility into What Matters
The unique value of vis/ability lies in its ability to automate the moment of the critical decision. It filters out non-essential alerts and focuses the team’s attention on the specific triggers that require immediate action. For seamless collaboration between remote experts and the command center, the Activu Link feature allows users to share their visual context instantly. This unified operating picture is essential for modern SOCs and NOCs, where the speed of information flow directly impacts the safety and security of the organization.
Next Steps for Operational Clarity
Transitioning to an event-driven model requires a shift in both technology and strategy. It begins with defining the critical parameters that drive your operation and ensuring your physical space supports these new workflows. Professional control room design is a vital component of this process, as it aligns the ergonomic needs of the operator with the technical capabilities of the event-driven visualization platform. To see how these layers integrate into your specific environment, contact Activu for a tailored demonstration and discover the clarity of a truly unified common operating picture.
Securing Operational Clarity through Automated Intelligence
Implementing an event-driven visualization platform is the definitive step toward eliminating information noise and operator fatigue. By automating the escalation of critical data, organizations ensure that the most urgent threats are never obscured by routine background activity. This fundamental shift from reactive monitoring to proactive management is why our solutions are trusted by federal defense agencies and global utilities to protect infrastructure. Absolute reliability is the standard when life-saving decisions are on the line.
The seamless integration of your existing VMS and SIEM tools into a single, unified intelligence layer provides the clarity needed to reduce incident response times when seconds matter most. Most control rooms already have the screens. What they’re missing is the layer that decides what goes on them and escalates automatically when something needs attention. By filling this gap, vis/ability ensures your team remains focused on the mission rather than the underlying technology. It provides a bedrock of certainty in high-stakes environments.
Achieving total situational awareness is no longer a manual struggle. Schedule a vis/ability demo to see your critical data in a new light. We are ready to help you build a more resilient and responsive command center.
Frequently Asked Questions
What is an event-driven visualization platform exactly?
An event-driven visualization platform is an operational intelligence layer that automates the delivery of critical data based on real-time triggers. Most control rooms already have the screens. What they’re missing is the layer that decides what goes on them, and escalates automatically when something needs attention. This technology removes the manual burden of data correlation, ensuring that the most relevant information is always at the forefront of the display.
How does event-driven visualization reduce operator fatigue?
It reduces fatigue by filtering out information noise and focusing operator attention only on actionable incidents. Instead of scanning dozens of static video feeds for hours, the team relies on the platform to surface anomalies automatically. This proactive approach prevents cognitive overload and ensures that operators remain sharp for the moment of the critical decision.
Can this platform integrate with my existing video wall hardware?
Yes, the platform is designed to be hardware-agnostic and integrates with most existing video wall processors and displays. It functions as a software-based intelligence layer that sits on top of your current infrastructure. This allows organizations to modernize their situational awareness without the need for a complete hardware overhaul.
Does an event-driven platform replace incident management software?
No, it serves as a unifying hub that makes your incident management tools more effective for the entire team. While tools like Axon provide valuable data, they often remain siloed within specific applications. The platform integrates these feeds into a single common operating picture, ensuring that everyone from the command center to the field sees the same mission-critical information.
What types of events can trigger a visualization change?
Triggers can include any digital signal from integrated systems such as SCADA alarms, geofence breaches, or cybersecurity alerts. For example, a sudden drop in grid frequency or a detected network intrusion can automatically change the video wall layout to show relevant camera feeds and geospatial maps. These parameters are fully customizable to match your specific operational reality.
How does this technology support mobile or remote team members?
The platform extends the common operating picture to mobile devices and remote huddle rooms through secure, real-time synchronization. Remote team members see the exact same visual context as the primary command center, which facilitates faster collaboration. This ensures that expert knowledge can be applied to an incident regardless of where that expert is physically located.
Is an event-driven platform secure for cybersecurity operations?
Security is a core component of the event-driven visualization platform, which is why it is trusted by federal defense and utility agencies. It employs robust encryption and role-based access controls to protect sensitive data feeds. This makes it an ideal solution for cybersecurity common operating pictures where maintaining the integrity of visualized data is a mission-critical requirement.