
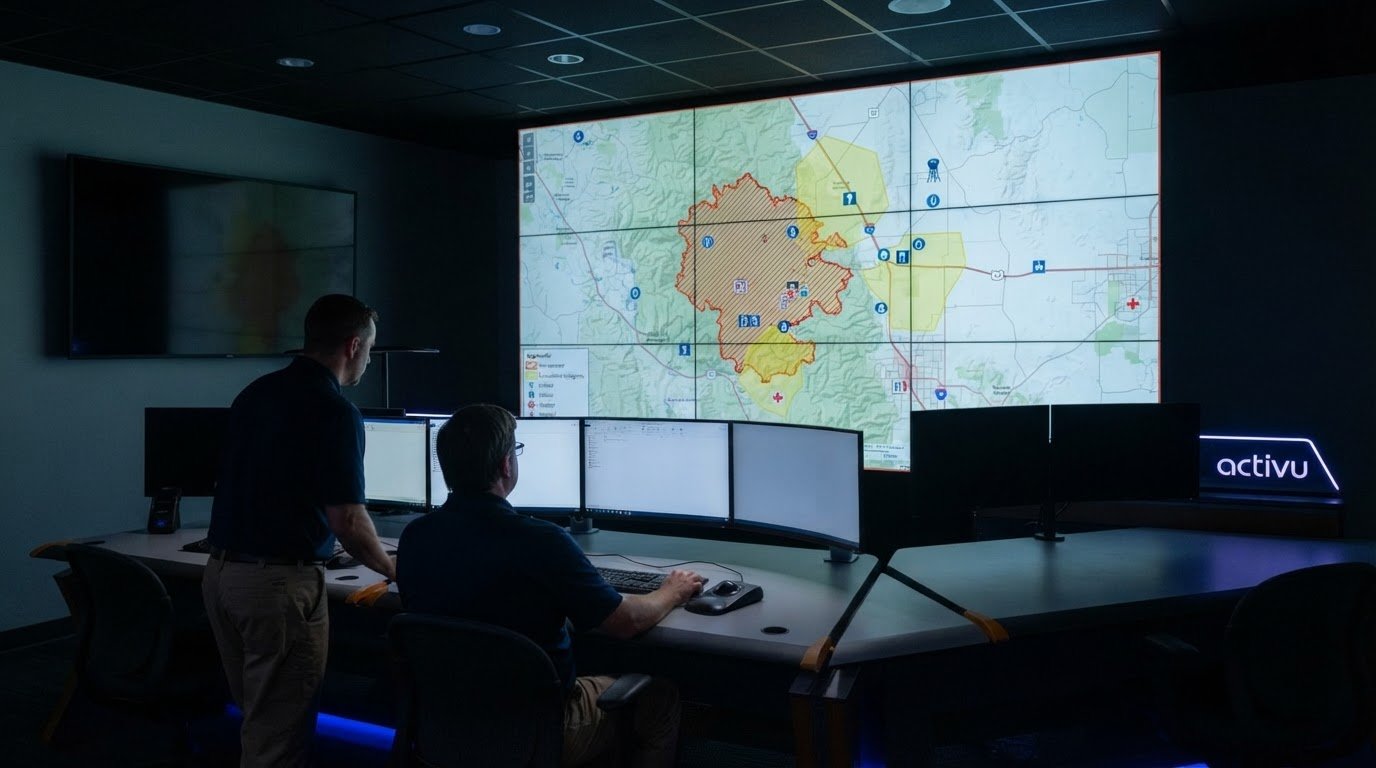
GIS helps emergency managers see where hazards may affect people, infrastructure, and response operations. In data-driven emergency management, spatial analysis brings hazard, demographic, infrastructure, and field data together in a shared geographic view. Teams can use it to map risk, plan responses, identify vulnerable communities, and track changing conditions and resources.
That geographic perspective matters because decisions depend on what is happening, where it is happening, and who or what may be affected. Maps and dashboards make connections between separate datasets easier to interpret, while real-time updates help teams maintain shared situational awareness as an incident develops.
This article explains how GIS supports hazard identification, disaster planning, response, recovery, and mitigation. It also explores how mapping vulnerable populations and critical infrastructure, combining observations with predictive models, and connecting field information to operational dashboards can give decision-makers clearer information when time and resources are limited.
Key Takeaways
- Layer hazard, infrastructure, and community data on maps to reveal where risk concentrates and which areas need priority attention.
- Use geographic analysis to assess evacuation routes and emergency facility locations against changing hazards and access conditions.
- Combine field observations with predictive models to inform preparedness, response, recovery, and mitigation decisions.
- Track vulnerable communities and critical infrastructure together to help direct outreach and response resources where they matter most.
- Bring updates from separate systems into a shared operational picture so teams can interpret changing conditions and coordinate their response.
How Does GIS Support Hazard Identifications and Risk Mapping?
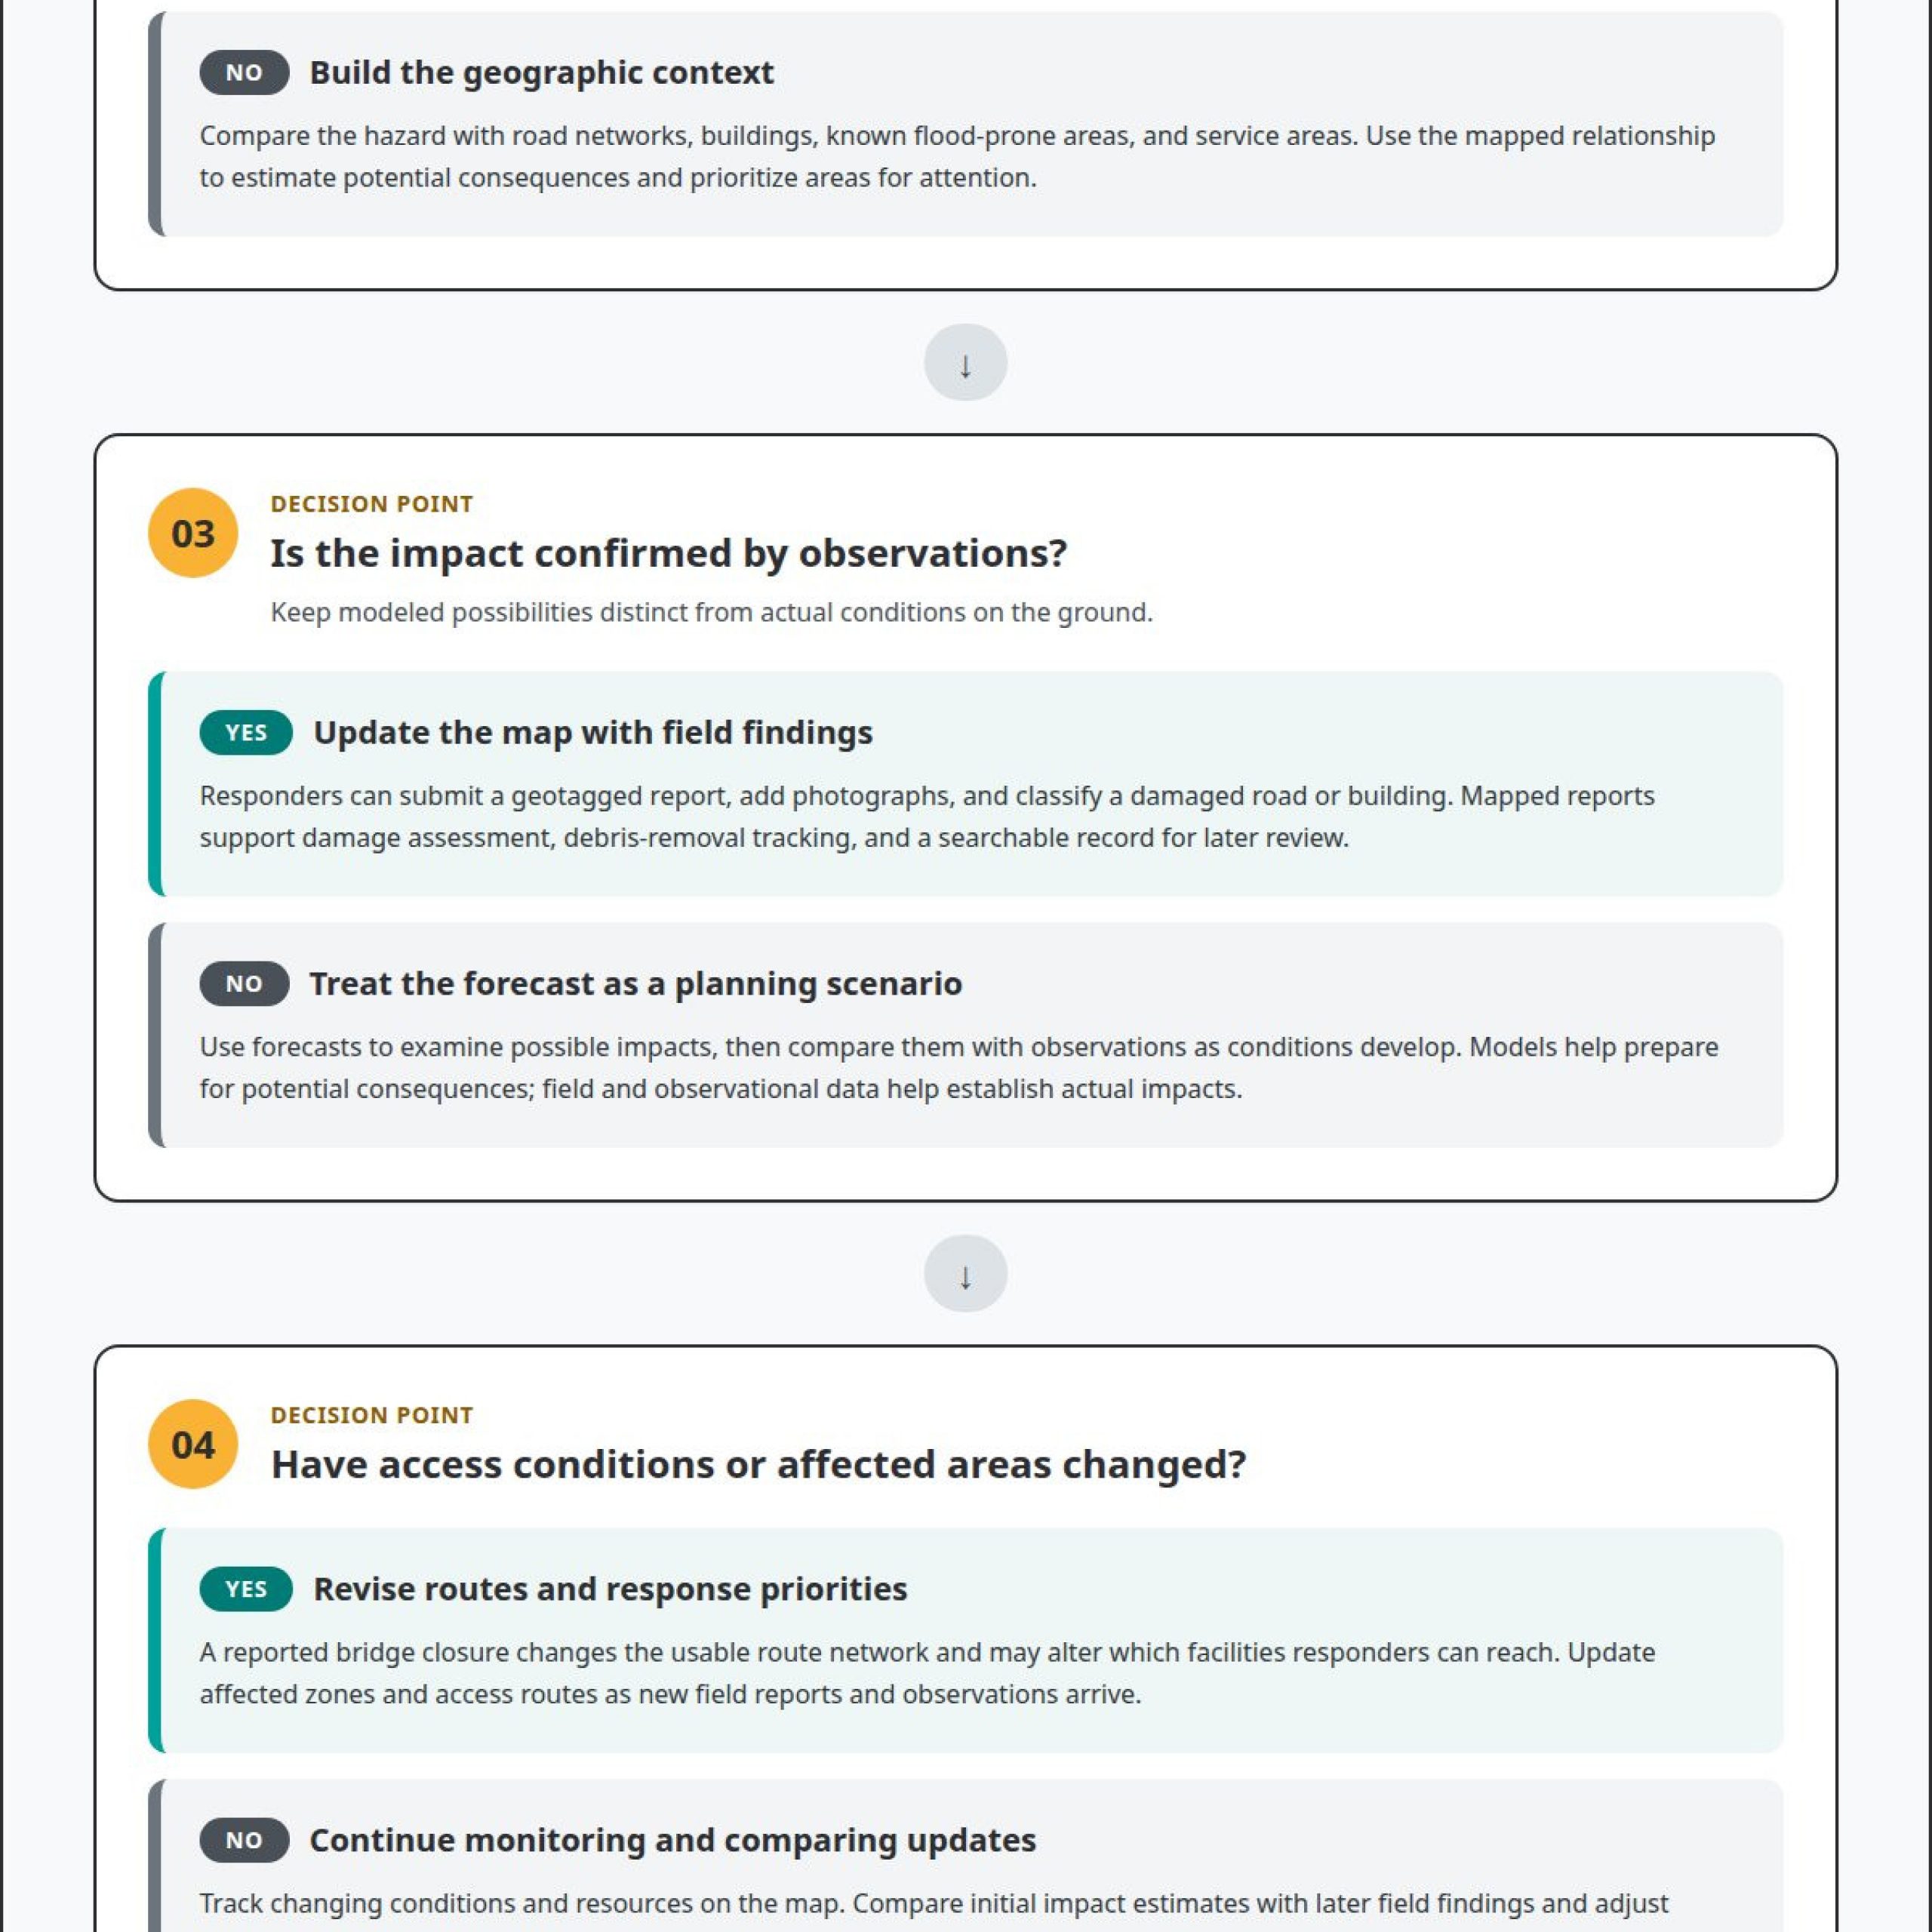
Emergency managers assess hazards by combining observations, predictive models, and location-based information. GIS places these sources on a shared map, helping teams identify exposed areas, estimate potential consequences, and prioritize response. For example, a flood forecast becomes more useful when mapped against roads, facilities, and known flood-prone areas.
Risk mapping starts with the hazard and the places it could affect. Teams can compare flood, wildfire, or storm information with road networks, building locations, and service areas. This helps distinguish an immediate threat from broader economic impacts, such as a route closure that could isolate a community or delay access to essential services.
Forecasts support planning, while field observations show actual conditions. The National Oceanic and Atmospheric Administration forecast that 6-10 storms would become hurricanes in 2025, with 70% confidence. Emergency managers can place forecast tracks beside local exposure data, then update priorities as observations clarify which areas face impacts.
Mobile GIS field applications help responders record damage at the location where it occurs. A field team can submit a geotagged report, add photographs, and classify a damaged road or building. These reports create a searchable record for assessment and help managers track debris removal. After a storm, teams can combine flood and damage assessments with existing internal datasets to support response and assistance delivery.
Remote sensing provides a wider view when ground access is limited. Satellite synthetic aperture radar can monitor hurricane impacts through cloud cover and darkness, unlike imagery that depends on suitable weather and light. Comparing imagery from before and after an event can help identify changed areas, guide field inspections, and direct crews to locations needing immediate assessment.
Real-time risk assessment depends on updating maps as conditions change. Teams can combine current field reports with new observations and forecast information, then revise affected zones and access routes. A reported bridge closure, for example, changes the usable route network and may alter which facilities responders can reach. Data-driven emergency management turns these updates into location-specific information for operational decisions.
GIS also helps managers maintain a clear record of how risk assessments evolve. Each mapped report can be linked to a location and observation, allowing teams to compare initial impact estimates with later field findings. This can reveal where forecasts aligned with actual damage and where response priorities need adjustment. The resulting map supports coordinated decisions without treating a model as proof of on-the-ground conditions.
Disaster preparation, response, recovery, and mitigation
GIS supports each disaster phase by connecting observations, forecasts, and operational information to place. That shared context helps agencies prepare, coordinate response, and direct recovery work as conditions change.
Geospatial Support for Disaster Response
Geospatial information guides decisions during an active disaster. A map can show incident reports alongside road access, facility status, and affected areas, helping response teams identify where conditions need attention. During recovery, GIS can track community lifeline status and communicate available resources to the public. Agencies can then update recovery priorities as field conditions and service access change.
Disaster Information Integration
Information integration combines separate data sources into a usable operational picture. A response team might bring together field reports, road conditions, facility updates, and weather observations, then compare them by location and time. Multimodal data can include mapped records, photographs, sensor observations, and written reports. Together, these sources help analysts interpret an incident from multiple perspectives and identify where reports support or contradict one another.
For coordinated sharing, agencies can limit access by role, share only information needed for an operational purpose, and separate sensitive personal details from general incident layers. These practices support collaboration while reducing unnecessary exposure of private information.
Spatial Analysis and Disaster Modeling
Spatial analysis compares hazard scenarios with exposed places, routes, and services. Predictive weather modeling can provide hurricane path predictions with lead times extending up to 120 hours. Emergency managers can use those forecasts to examine possible impacts, then compare them with observations as the storm progresses. Models help prepare for potential consequences; field and observational data help establish actual impacts.
Scenario planning also tests whether response protocols hold under changing conditions. For example, teams can use historical flood, road-network, and energy-infrastructure data to examine access disruptions. A simulated road closure can reveal whether response routes or service dependencies need adjustment before an event.
Emergency Data Sources and Technologies
Emergency data sources include weather forecasts, satellite observations, field reports, infrastructure records, and demographic information. GIS, interactive dashboards, and geospatial visualizations help teams combine and interpret these inputs. Data-driven emergency management depends on distinguishing observed conditions from modeled possibilities. This helps decision-makers understand which information describes current impacts and which signals a potential threat.
During preparation, agencies can use models and historical datasets in exercises. During response, they can integrate new reports as conditions develop. In recovery, mapped service updates can show where assistance and community lifelines remain available. An integrated operational awareness platform can bring relevant applications and information into a shared view, supporting coordinated interpretation.
How Can GIS Help with Emergency Management?
GIS supports evacuation planning by showing how hazards, routes, and emergency facilities relate geographically. Emergency managers can compare evacuation routes with hazard zones, road access, and facility locations, then adjust coordination as conditions change.
In the United States, agencies align emergency data practices with applicable federal, state, and local requirements, as well as their privacy, security, retention, and sharing policies. Requirements depend on the data and its use, so maps should separate public information from restricted records.
To build a data-driven emergency management program, agencies can define decision needs, connect relevant datasets, map routes and facilities, establish access rules, and test workflows in exercises. Each step should support a specific operational decision, such as identifying an accessible evacuation route or locating a facility outside a projected hazard area.
For evacuation planning, GIS can compare route options with flood exposure, road-network data, and emergency facility locations. A route that appears direct may become unusable if flooding blocks a crossing. Mapping alternate paths and facilities gives coordinators options to reassess when new conditions affect access. Facility placement analysis can also identify gaps between service locations and the areas they need to support.
Equitable evacuation outreach starts with understanding who may face barriers to receiving or acting on an alert. Emergency managers can use geocoded records of people with access and functional needs, mobility limitations, or language barriers to support targeted outreach. For example, location-linked records can help planners identify where accessible transportation or translated instructions may be needed. Restrict these records to appropriate users, and show only coordination-relevant information on public maps.
Coordination improves when agencies share a geographic view of evacuation zones, route status, and facility availability. An emergency operations center can compare municipal road updates with shelter locations and field reports. This shared context helps teams identify conflicting information, communicate route changes, and direct responders to areas where access remains possible.
A U.S. example is the U.S. Coast Guard’s geospatial-data-driven response to a port incident. The port reopened in 76 days. This case illustrates how location-based information can support response coordination around a complex infrastructure disruption.
GIS has limits: a model describes potential conditions, while field observations establish actual impacts. Outdated road records, incomplete reports, or network failures can affect route decisions. Agencies can assess program effectiveness by reviewing whether exercises and incidents produced timely route updates, usable facility maps, coordinated outreach, and documented plan changes. These measures connect GIS outputs to operational decisions rather than map production alone.
Mapping vulnerable populations and critical infrastructure
GIS brings community characteristics, hazard exposure, and infrastructure locations into a shared spatial view. This helps emergency managers identify where a hazard could disrupt essential services or create additional barriers for residents.
Combining Infrastructure, Hazard, and Demographic Data
A combined map overlays hazard zones with demographic patterns and infrastructure assets. For example, a flood layer can be viewed alongside roads, power facilities, health services, and population characteristics. This reveals where hazard exposure intersects with systems that support daily life. Emergency managers can use these connections to set priorities for outreach, inspections, and continuity planning.
Comparing map layers can expose dependencies that a single asset map may conceal. A power disruption can affect facilities that rely on electricity, while a road closure can limit access to those facilities. Mapping service locations with their surrounding networks helps teams identify communities that may experience several linked disruptions. Analysts can then distinguish an isolated asset concern from broader service-area risk.
Demographic layers add context to exposure. They can show where residents may need accessible information, transportation support, or help reaching services. Use these patterns to guide planning at an appropriate geographic scale, rather than implying that everyone in a mapped area has the same needs. Local knowledge and updated observations help teams interpret the map.
Vulnerability and Infrastructure Maps
Vulnerability maps show how a hazard may affect communities and the systems they depend on. Critical infrastructure layers can include transportation routes, energy assets, water services, healthcare locations, and communication networks. Where these features overlap with a hazard area, planners can identify locations where service interruption could compound local exposure.
For example, a wildfire perimeter near a road corridor and a community service facility can prompt focused monitoring of access and continuity. A map helps teams see the relationship between the threatened area, alternative routes, and nearby service locations. This geographic context supports decisions about where to focus attention and which facilities need status updates.
Technical infrastructure needs careful mapping because network effects cross administrative boundaries. Electricity, communications, water, and transportation systems may connect assets across jurisdictions. A regional view can show how a disruption in one location may affect services elsewhere. Emergency managers can use this view to coordinate status reporting and identify gaps in shared awareness among agencies.
Maps also need to distinguish current conditions from planning assumptions. A facility symbol shows location, not operational status; a hazard layer shows exposure, not confirmed damage. Teams can pair asset records with field reports and time-stamped updates, then prioritize verification where potential impact is greatest. This keeps interpretation tied to evidence and helps prevent outdated infrastructure records from driving decisions.
For communities, the value lies in turning complex relationships into clear priorities. GIS can help decision-makers identify locations with elevated hazard exposure, service dependencies, and barriers to access. These insights support targeted planning while keeping human judgment central to how resources and communications are directed.
Real-time situational awareness and resource tracking
Live updates help response teams understand how an incident changes across locations. GIS dashboards can bring reports, operational statuses, and resource information into a shared view, supporting decisions as conditions develop.
Real-Time Dashboards
A real-time GIS dashboard displays changing incident information in a shared geographic context. Response teams, stakeholders, and the public can use dashboards to support critical decisions and shared situational awareness. For example, an emergency operations center can view reported road closures alongside incident locations and service updates. Clear timestamps help users distinguish recent reports from older information and focus on current operational needs.
Real-Time Data Collection and Analysis
Real-time data collection captures incoming observations and makes them available for operational analysis. A field responder can submit a location-based report about a blocked route, while another team records a facility status. Analysts can compare these updates with incident reports and identify where conditions have changed. Agencies should also test whether mobile field equipment works offline and can remain linked to the command center during network failures.
Analysis gives incoming reports operational meaning. A single closure may require a route adjustment; several nearby closures may indicate wider access disruption. Teams can filter information by location, report type, and update time, then identify conflicts that need clarification. This keeps situational awareness tied to reported conditions instead of an outdated operational picture.
Resource Tracking
Resource tracking records where response assets are assigned and the status teams report. A shared map can show locations with responders, supplies, or equipment assigned, alongside incidents that still need attention. Coordinators can compare reported availability with operational priorities and redirect resources when a new incident changes demand. Clear status categories help prevent assigned resources from being mistaken for available ones.
For example, an emergency operations center can compare incident locations with reported team assignments and facility needs. If a field update identifies a new access problem, coordinators can review nearby assignments and communicate a revised priority. The map supports coordination, while responders and decision-makers determine the action. Time-stamped updates help teams see whether a resource record reflects current conditions.
Reliable awareness depends on consistent reporting. Agencies can define shared status terms, identify who updates each record, and distinguish confirmed observations from unresolved reports. During an exercise, teams can test how quickly updates reach the shared dashboard and whether users interpret them consistently. These checks reveal gaps in data collection, analysis, and coordination before an incident puts those workflows under pressure.
When teams combine current reports with clear resource status, they can prioritize attention and explain decisions across agencies. The operational picture becomes more useful when each update answers three practical questions: what changed, where it changed, and which response decision it affects.
Activu Corporation: Event-Driven Situational Awareness
Activu Corporation helps teams address fragmented systems, information silos, and gaps in event escalation. These issues can leave dispatchers managing separate feeds, limit an EOC’s common operating picture, and make important incidents harder for operators to spot.
Many control rooms already have screens. What they need is a layer that determines what appears on them and escalates events when they need attention. The vis/ability Platform provides that operational intelligence layer, bringing applications and data feeds into a central hub. Information can then appear on the video wall as vis/ability organizes and surfaces what is relevant.
Teams can use vis/ability across command centers, remote locations, conference rooms, breakout rooms, huddle rooms, and mobile devices. Event-Driven Situational Awareness helps bring attention to operational events across those settings. To discuss your control-room requirements, contact Activu Corporation.
Turn operational priorities into a clearer response
The next step is to define what decision-makers need to see, which events require attention, and how teams share updates during an incident. Those priorities shape a practical approach to data-driven emergency management, grounded in the decisions responders must make rather than the volume of available data.
Activu Corporation provides Video Wall Systems, the vis/ability Platform, and Event-Driven Situational Awareness. These offerings help organize and present operational information in a shared view for teams interpreting conditions and coordinating action. An effective operational picture keeps essential information visible at the decision point.
Consider where fragmented data or delayed escalation complicates your response today. A focused discussion can help clarify the operational gap and identify a suitable direction for your control room. Contact Activu Corporation to discuss your requirements and next steps.
With clear priorities and connected information, your team can move forward with greater focus and confidence.
Frequently Asked Questions
How Predictive Analytics Helps in Emergency Preparedness?
Predictive analytics helps emergency managers estimate possible impacts before an incident unfolds. Models can compare forecast conditions with historical events, population patterns, and infrastructure dependencies. For example, a storm scenario can help planners examine which services may face disruption and which response options deserve attention. These outputs inform preparation, but remain projections. Teams should distinguish modeled possibilities from observed conditions and use exercises to test how forecasts shape decisions.
What are the Struggles in Traditional Emergency Preparedness?
Traditional preparedness can leave teams working from separate plans, outdated records, and limited opportunities to test coordination. A paper route plan, for example, may not reflect a newly closed road or changed facility status. Separate reporting channels can also make it harder to establish a shared operational picture. Exercises expose these gaps by testing how information moves between teams, who updates plans, and how decision-makers respond to changing conditions.
What is data-driven emergency management?
Data-driven emergency management uses structured information to inform preparedness, response, recovery, and mitigation decisions. It combines observations, records, models, and analysis to help leaders understand conditions and compare possible actions. For example, incident reports and service status can help prioritize recovery follow-up. Data supports human judgment; it does not make decisions on its own. Its value depends on relevance, clear interpretation, and timely communication to those responsible for action.
How is data used for emergency response and resource allocation?
Emergency teams use incident reports, location information, and resource status to match response capacity with operational needs. A coordinator can compare incoming calls with reported crew assignments and facility requirements, then identify where attention or support is needed. Clear status definitions matter: “assigned” should not be confused with “available.” Teams also need to record when information was updated so decisions do not rely on resource records that no longer reflect field conditions.
How do data-driven and traditional emergency management approaches compare?
Traditional approaches often rely on established plans and manual reporting, while data-informed approaches add ongoing analysis and updated operational information. A written evacuation plan remains useful, but mapped road reports can help teams assess whether its routes remain accessible during an incident. Neither approach replaces leadership, training, or coordination. The practical difference is how readily teams can incorporate new information, identify changing conditions, and adjust decisions while preserving tested procedures.
What tools and systems do emergency management agencies use, and how much do they cost?
Agencies may use GIS, forecasting models, field-reporting applications, dashboards, and systems that integrate operational data. Costs vary with project scope, integrations, configuration, and the systems involved; pricing is provided after a quote request. A useful evaluation considers how the tools fit existing workflows, present essential information, and support coordination across teams. The relevant system mix depends on operational needs, data sources, security requirements, and how information must reach decision-makers.
What are examples of successful data-driven emergency management programs in the United States?
The U.S. Coast Guard used a geospatial-data-driven response to reopen Baltimore’s port in 76 days.