
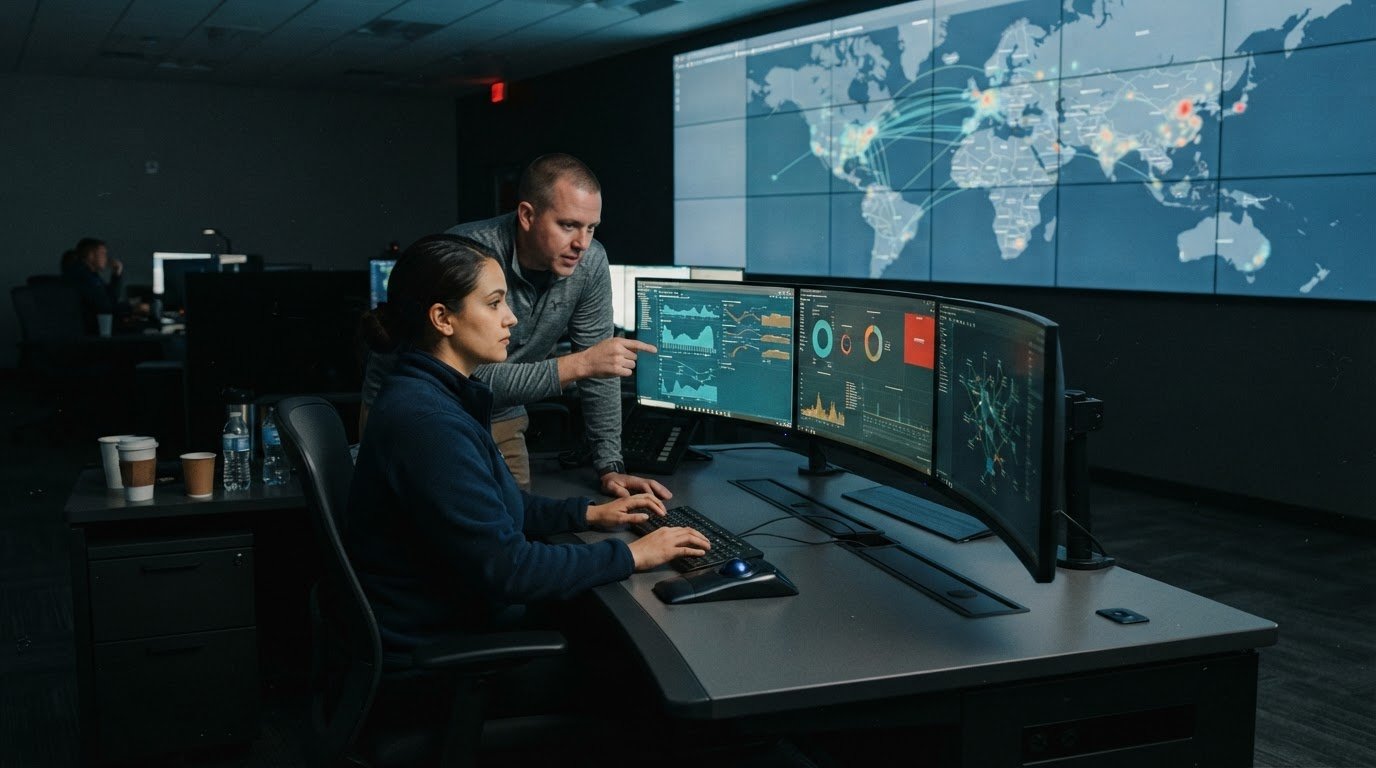
A NOC can show every feed and still leave operators unsure what to do next. The answer to what to display in a NOC is a prioritized operational picture: critical alerts, service availability and performance, and the relationships between cloud, on-premises, and remote-site systems. Fragmented tools, siloed data, and unclear escalation paths can obscure the signals teams need to act.
Operators need views that make sense at a glance, connecting incidents to their impact and ownership instead of burying them in separate dashboards. Most control rooms already have the screens. What they’re missing is the layer that decides what goes on them – and escalates automatically when something needs attention.
This guide explains which alerts and availability metrics deserve priority, how to bring hybrid infrastructure into a shared view, and how to shape dashboards for workstations and a video wall. Activu Corporation’s vis/ability is an operational intelligence layer that surfaces through the video wall, unifying integrated application feeds in a central hub so teams can focus on the information relevant to their next decision.
Key Takeaways
- Prioritize alerts by operational impact and make ownership and escalation paths visible.
- Bring cloud, on-premises, and remote-site signals into a shared view to expose dependencies across environments.
- Group related alarms and suppress duplicates so operators can focus on the likely underlying issue.
- Choose availability views that communicate service health clearly and remain readable at a glance.
- Use vis/ability as the operational intelligence layer that surfaces through the video wall and connects teams across locations and devices.
The operational gap: fragmented feeds and missed escalations
NOC teams can have abundant telemetry and still lack a reliable picture of what needs attention. Network alerts, application health, cloud events, facilities conditions, and service tickets often arrive through separate tools. Each feed may be accurate on its own, but operators still have to connect signals, assess their impact, and determine who owns the response. That manual work slows decisions and makes important relationships harder to see.
Operational silos deepen the problem. Network staff may see a device failure while application teams track a service degradation and facilities staff monitor a power or environmental issue. Without shared context, each group sees only part of an incident. Teams can duplicate investigation, miss dependencies, or disagree about whether an alert represents an isolated fault or a wider service impact. A shared control-room operating picture helps bring those perspectives into the same operational context.
Visibility alone does not ensure that the right person acts. If an alert stays in its originating system, relies on someone noticing it, or lacks a clear escalation path, response can stall during handoffs. A useful operating model connects event detection with context, ownership, and escalation, while keeping status visible as work progresses.
Most control rooms already have the screens. What they’re missing is the layer that decides what goes on them – and escalates automatically when something needs attention.
- Fragmented feeds: Operators switch between tools and must manually connect related symptoms.
- Operational silos: Separate teams hold different pieces of the incident picture.
- Missed escalation: Alerts can remain unassigned or unseen when routing depends on manual attention.
These gaps shape what to display in a NOC: information should help operators recognize impact, understand relationships, and see where action is needed. The goal is a shared, current view that supports human judgment and makes escalation part of the workflow, rather than a separate task dependent on someone spotting the right signal.
Monitoring hybrid cloud and on-premises environments
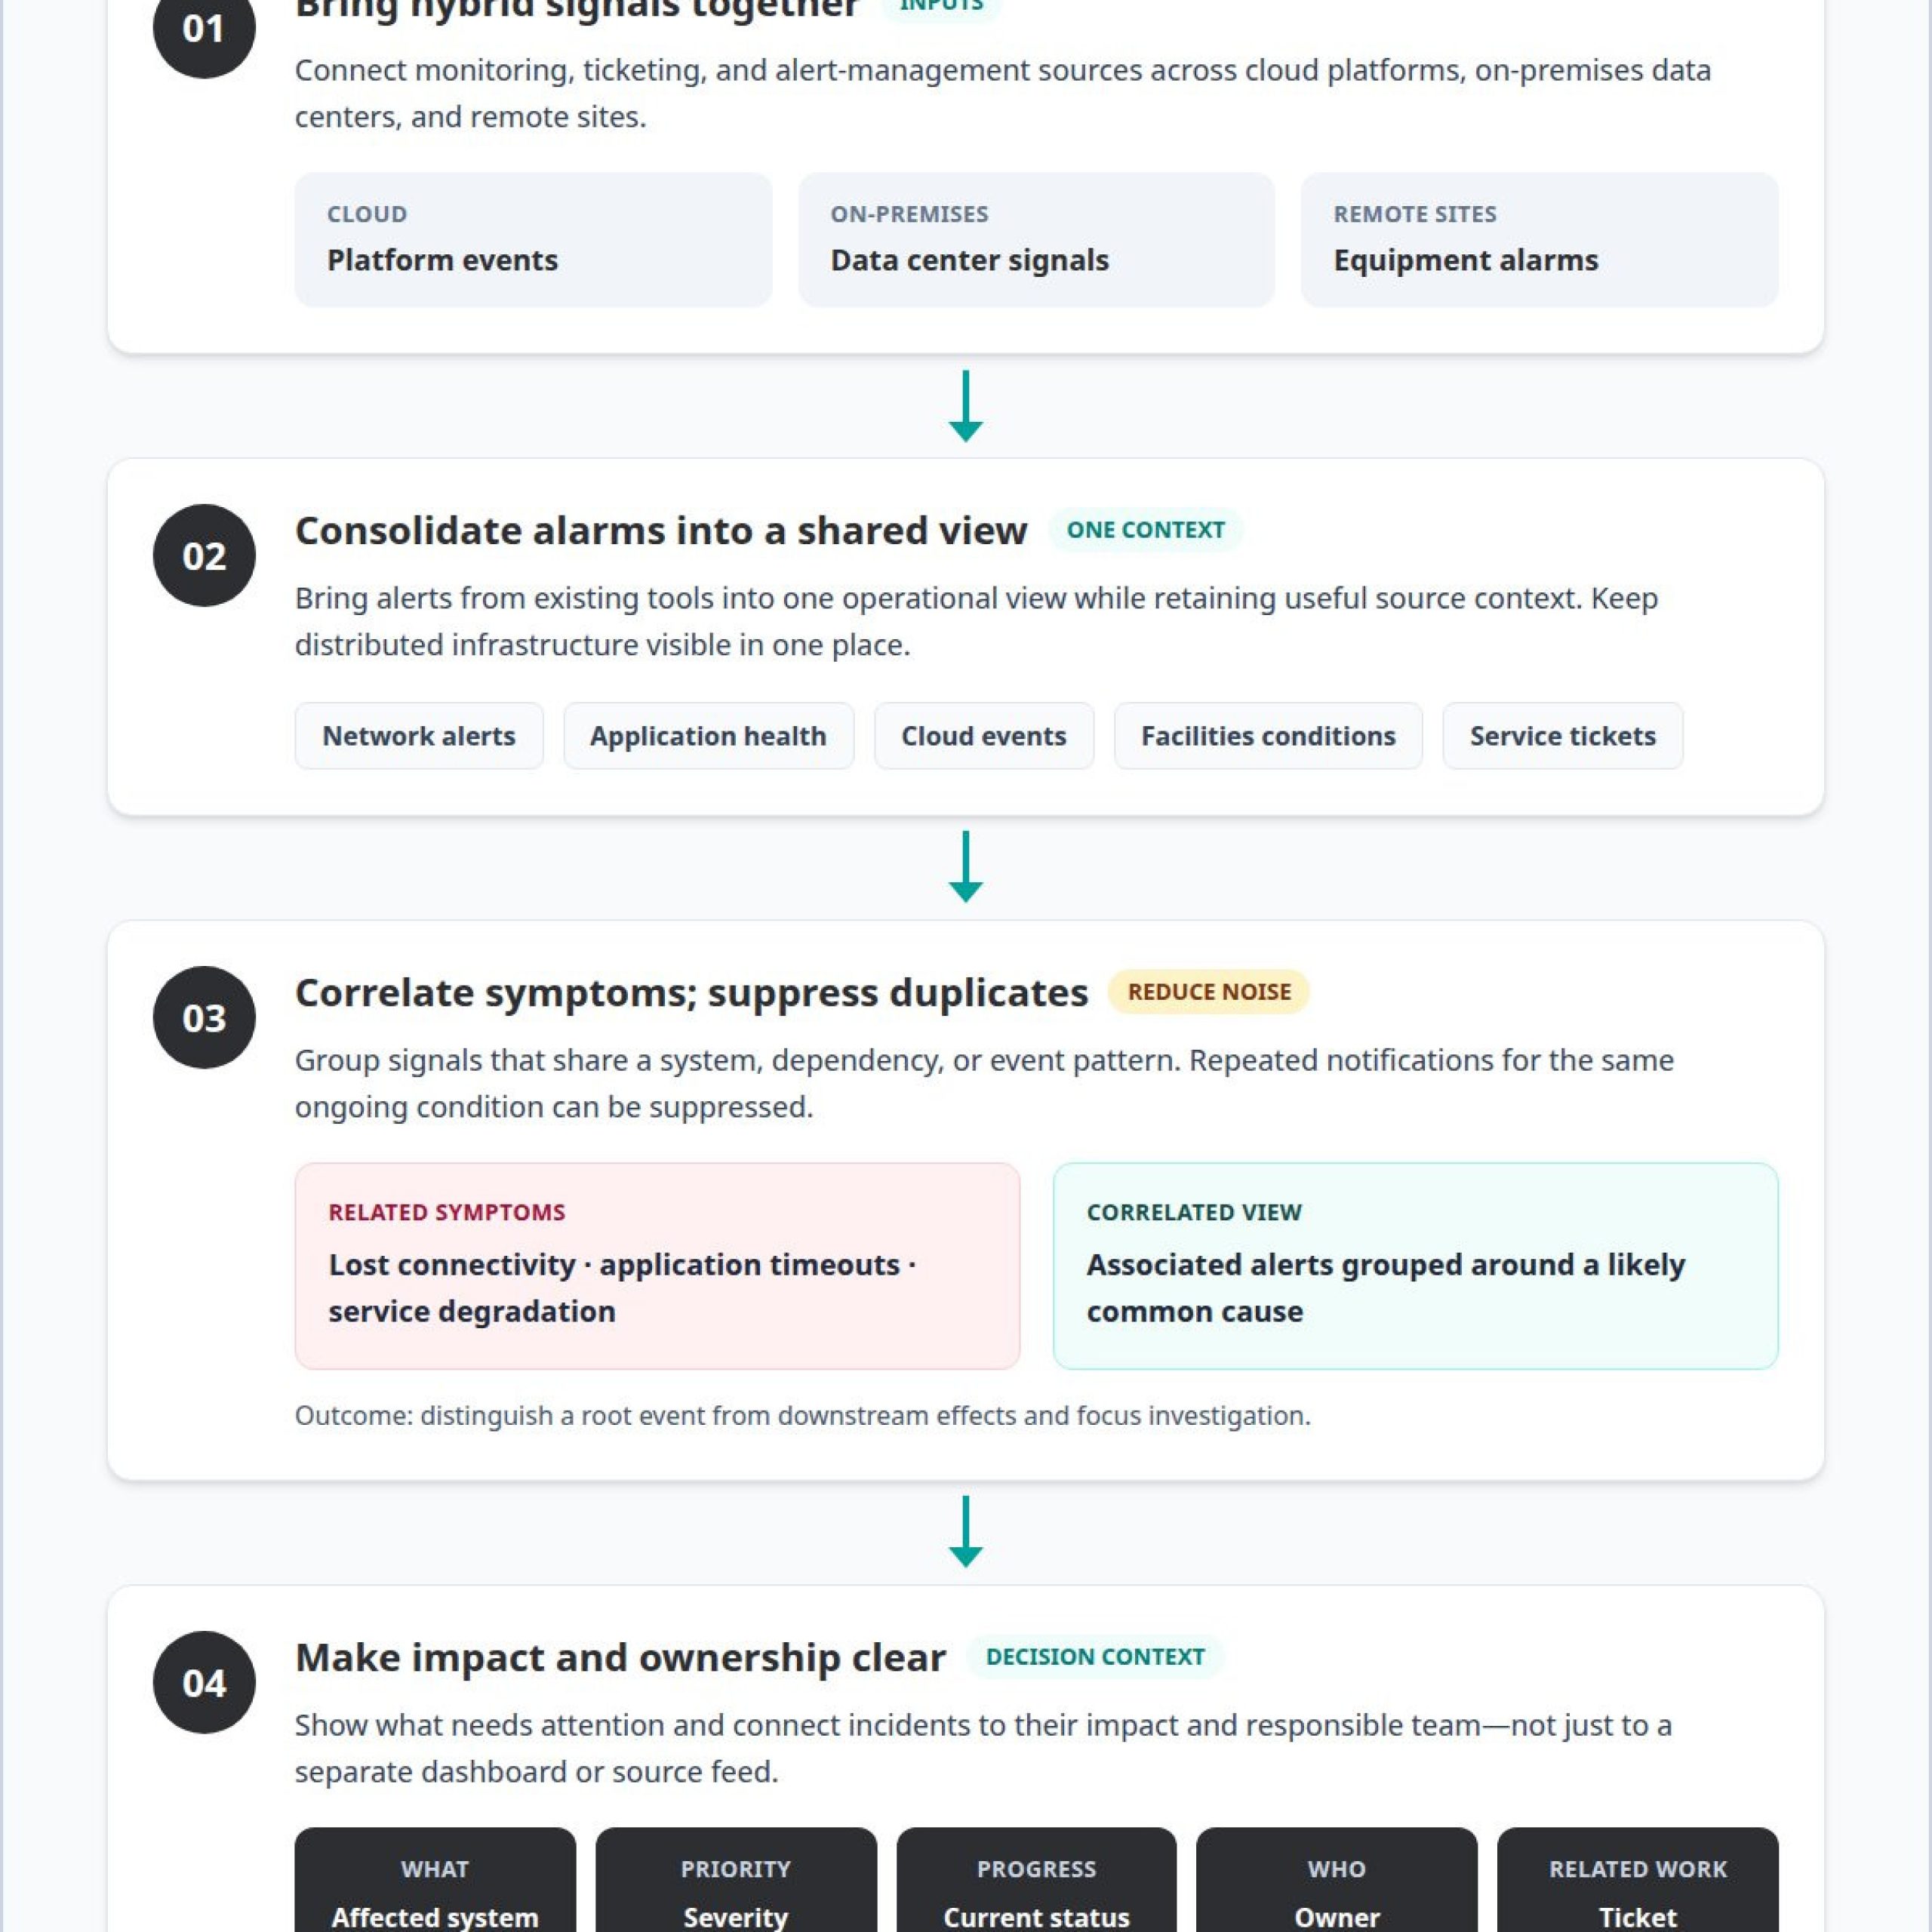
A NOC team needs one operational view across on-premises systems, cloud platforms, and remote sites. Integrating monitoring, ticketing, and alert management helps operators connect infrastructure signals to incidents and response status.
Monitoring System Integrations
Monitoring integration connects infrastructure alerts and service-management records across separate tools. A hybrid view can bring Amazon Web Services, Microsoft Azure, Google Cloud, and on-premises data center signals into one console. Common monitoring platforms include SolarWinds, Nagios, Zabbix, Zenoss, Dynatrace, Datadog, Amazon CloudWatch, and Azure Monitor. Integrating these sources helps the NOC team assess service impact without switching between isolated dashboards.
Alert Consolidation and Unified Alarm Monitoring
Unified alarm monitoring brings alerts from existing tools into a shared view while retaining useful source context. One infrastructure failure can produce many alerts across monitoring tools, cloud platforms, and application layers. Consolidation helps operators identify the affected service and distinguish related signals from separate events. Remote-site equipment alarms can also appear on a central display, giving the NOC team one place to monitor distributed infrastructure.
Alerts and Incidents for Display
Display alerts that indicate service degradation, infrastructure failure, unusual changes, or an incident requiring action. Include the affected system, severity, current status, owner, and related ticket when available. For example, a cloud service alert paired with an on-premises network event may reveal a shared dependency. Ticketing integration can create incident records when alerts identify a problem and update or close them when the alert clears.
Security and Threat Monitoring Data
Security views should show threat alerts alongside the infrastructure and service context needed to assess operational impact. Include the affected asset, alert category, event time, status, and assigned response where available. For example, linking a suspicious activity alert to a server outage can help operators decide whether the events need coordinated attention. A cybersecurity common operating picture brings these signals into a shared operational view.
Alert correlation and duplicate suppression
One infrastructure failure can generate many alerts across tools, cloud platforms, and applications. If each appears as a separate incident, network operations staff must sort through noise before diagnosing the cause. Correlation groups signals that share a system, dependency, or event pattern, giving engineers a clearer starting point than a long sequence of unrelated notifications.
Consider a failed network device that disrupts several dependent services. Monitoring tools may report lost connectivity, application timeouts, and service degradation. Correlation links these symptoms to a likely common cause and presents the associated alerts together. Operators can assess the impact, identify affected services, and focus investigation on the originating fault. The goal is to distinguish a root event from its downstream effects.
Duplicate suppression reduces repeated notifications for the same ongoing condition. An unreachable device may trigger recurring alerts, but each repetition adds little to the incident view. The alarm system can suppress duplicate display entries while retaining incoming alarm records for later review. This keeps the live queue readable without removing information needed for incident analysis.
- Group related signals: Link a device failure with dependent service errors and connectivity loss.
- Suppress repeated notices: Keep one active incident visible when the same fault continues.
- Preserve alarm history: Retain inbound events for review even when nuisance alarms are filtered.
Effective correlation depends on meaningful relationships between alerts, not simply their arrival at the same time. A shared device, service dependency, or recurring event pattern can help establish that relationship. The console should show the correlated incident, its likely underlying cause, and the signals supporting that assessment. Engineers then retain access to the detail behind the summary instead of losing context through suppression. This approach gives network teams a focused operational view while preserving the evidence needed to investigate.
An effective NOC console groups related alerts, suppresses duplicates, and surfaces correlated incidents that point to likely underlying causes. A NOC alarm master should filter nuisance alarms while continuing to log all incoming alarms for later review.
This keeps the incident view focused while preserving the alarm record. Operators can use the surfaced incident to guide their investigation, with incoming alarms still available for later review.
Availability dashboard considerations
A useful availability dashboard connects current service health to impact and action. Live views should use five-minute data and keep essential metrics visible without scrolling.
Real-Time Network Health Metrics
Deciding what to display in a NOC starts with measures operators can act on: service availability, uptime, active incidents, and SLA performance. These indicators show whether infrastructure problems affect a service and help staff identify where attention is needed.
Use percentage indicators consistently, with 0% meaning bad and 100% meaning perfect. This scale makes status easier to interpret across dashboard panels. Refresh the live view with five-minute data so operators can assess recent changes. Place availability beside the affected service and incident status. For example, an application’s degraded availability beside its open incident gives the NOC team useful context for prioritizing its response.
Network Topology and Service Dependencies
Topology views map devices and connections; dependency views show how infrastructure supports services. A map can locate a remote-site alarm, while service relationships reveal which applications depend on an affected network component. Together, these views help operators understand potential impact before choosing an action.
For teams deciding what to display in a NOC, show the affected node, connected services, and active alarm in a legible layout. If a network component and service degradation appear together, make their relationship visible rather than asking operators to compare separate panels. Apply green, yellow, amber, and red consistently to communicate severity. Place labels beside relevant topology elements so the colors retain meaning and operators can identify the service needing attention.
Prioritize the map or topology view that answers the current operational question. Keep supporting detail available at workstations without crowding the main status picture. This directs attention to service availability, dependencies, and the next decision while preserving the detail operators need to investigate.
The live dashboard should present 5-minute data in a view that fits the screen without requiring scrolling. Keeping the essential status visible makes the dashboard easier to use as a shared operational reference: staff can see the current picture without moving away from the information needed to assess it. Avoid letting supporting detail displace the main service and health indicators. A compact arrangement can still preserve useful context, provided the key status remains on screen and the display is easy to scan. These constraints are especially important when conditions change, because operators need the live view to remain legible as they review service health and active issues.
Use green, yellow, amber, and red consistently to communicate issue severity throughout the dashboard. Color should reinforce visible labels and service context, not carry the message alone. The NOC master station should provide a straightforward interface and detailed notifications. Together, these choices support a dashboard that is readable at a glance and useful for following up on changes. Keep the interface uncluttered and notifications timely, with enough detail for operators to understand current conditions without scrolling. The result should help staff move from seeing a status to understanding its importance without adding visual complexity.
Alarm ingestion, correlation, and ticketing automation
An alarm pipeline should turn incoming events into correlated incidents, actionable tickets, and a focused operations view. For example, a network failure can trigger an alert, create an incident record, and route it for response.
Ticket metrics show whether work is progressing or accumulating. Display ticket queue volume, average ticket age, and progress against SLAs and SLOs beside active incident status. Bidirectional integration with an ITSM system can create tickets when incidents appear, then update or close them when alerts clear. This keeps the dashboard and incident record aligned as engineers handle the event.
A practical automation flow links detection to ownership:
- Correlate related alarms and identify the incident they represent.
- Create or update the ITSM ticket with the incident status.
- Route the event to the responsible team for acknowledgment and action.
On-call engineers should be able to acknowledge, assign, and forward incidents from a phone. This keeps the response path visible when an operator is away from the NOC workstation.
Orchestration can connect event data with approved remediation actions. Keep live dashboard actions focused on work that can be completed within the same hours. Remediation that cannot be completed within the same day belongs in a separate work view, not the live operational picture. Analytics can then help teams review recurring incident patterns and identify where workflows stall.
Automatic dashboard rotation should follow operational relevance, not a fixed sequence that hides urgent information. For example, keep an active high-impact incident and its assigned owner visible, while routine performance views rotate when they need attention. Each screen should retain enough context for operators to recognize the current issue and next action.
Public-facing NOC screens should exclude credentials, detailed network diagrams, sensitive security alerts, and ticket notes that reveal internal response details. Show only approved summaries, such as service status or a general incident notice, and keep operational specifics in access-controlled views.
NOC video walls and visual command centers
Separate network, application, and cloud feeds can leave operators assembling context during an incident. A video wall becomes useful when those signals form a shared operational picture, with critical alarms, service status, and affected locations visible together. In network operations centers, displays should help teams interpret conditions and decide where attention is needed.
With vis/ability, the video wall presents operational information according to its relevance to the current situation. Teams can use that common picture in control rooms and remote locations, then carry the same operational context into conference rooms, breakout rooms, huddle rooms, and mobile devices. The value lies in helping people make decisions from a consistent picture, not merely showing more feeds.
For layout, give active incidents and priority alarms a prominent position, then place supporting service metrics, maps, and team assignments nearby. A projected dashboard should pass a five-second interpretation test. Keep labels and status indicators large enough to read at a distance; 9-point Calibri may work on a laptop but becomes difficult to read on a projected screen.
Scale the view to the room. Large network operations centers commonly arrange 8-12 workstations in front of a video wall, while smaller operations centers may use 1-3 workstations and a few televisions. In either setting, show information relevant to the whole team, such as incident summaries, alerts, performance metrics, and shift assignments. During handover, an outgoing operator can use the shared view to communicate open incidents and current response status.
A map can make remote-site alarms easier to locate, while a service summary clarifies operational impact. Avoid putting every available feed on the wall at once. Vis/ability helps teams bring relevant information forward for the current situation, while operators retain detailed views at their workstations. The result is a visual command center that connects data with human judgment across locations and devices.
Activu Corporation
Activu Corporation helps NOC teams align applications, data streams, and shared displays with operational needs. It is a natural next step when teams know what information they need but still face gaps between systems, locations, and response workflows. The aim is to make relevant information available in context, helping operators interpret conditions and coordinate decisions without relying on disconnected views.
The vis/ability platform acts as a central hub for operational information. Application integration brings complex feeds into a shared operating picture, while event-driven situational awareness helps teams surface information as conditions change. Together, these capabilities connect data sources, organize what operators see, and make a common view useful to the people responsible for action.
Consider Activu when separate tools make it difficult to assemble a coherent picture, or when staff need operational information across different work settings. The right arrangement depends on the applications involved, the roles using them, and how teams coordinate. A NOC, for example, may need infrastructure and service information together, while distributed staff may need a shared view beyond the primary control room.
Activu’s video wall systems provide a shared display for prioritized operational information, and Mobile vis/ability extends access to mobile users. Together with the platform, these offerings support teams in control rooms, remote locations, conference rooms, breakout rooms, and huddle rooms. Activu also provides control room design services to align the operational environment with how teams use information and collaborate.
If fragmented feeds or disconnected workflows are limiting your team’s visibility, Activu Corporation can discuss how its offerings fit your operational needs. Contact Activu Corporation to discuss your NOC visibility needs.
Frequently Asked Questions
How to Choose the Right Solutions for Your NOC?
Choose a NOC solution by assessing how it fits your existing data sources, workflows, and display environment. Activu Corporation’s vis/ability works with existing displays, networks, and data sources, so teams can build on their current environment. Consider whether staff also need access outside the control room. Mobile visibility and shared content, for example, can support decisions during remote collaboration without confining the operational picture to one room.
What information should a network operations center (NOC) dashboard display?
A NOC dashboard should provide the operational context staff need to understand an event, not just stream raw data. Useful examples include a real-time map, relevant video, event status, and an incident-management view. Activu’s vis/ability supports real-time maps, video feeds, dashboards, event management, and a ServiceNow incident dashboard. Combining relevant sources helps operators assess events without treating each application as an isolated workspace.
How should NOC screens display outages, SLAs, and service availability?
Show outages alongside the affected service, current availability, outage duration, and progress against the applicable SLA. Distinguish a full outage from degraded performance, since each signals a different operational condition. For example, a service-status panel can identify an unavailable application while showing its supporting infrastructure separately. Keep status and target visible together so operators can judge the gap and decide what operational update or escalation should follow.
How can a NOC reduce alert fatigue and prioritize critical events?
Reduce alert fatigue by filtering notifications according to staff responsibilities and routing relevant alerts to people outside the NOC when needed. A facilities operator, for example, needs different notifications from a network engineer. Set clear event priorities and make escalation paths visible to the responsible team. Mobile access can help authorized staff acknowledge, assign, or forward an incident without requiring them to remain at a control-room workstation.