
A million-dollar video wall is a liability if it only serves to display more noise for an exhausted operator to filter. You likely face skepticism from leadership who view “better visibility” as an intangible metric rather than a financial asset. When operators are forced to monitor dozens of disconnected screens, fragmented data streams inevitably lead to delayed responses and increased risk. This makes calculating ROI for a new video wall system a challenge of quantifying time and judgment rather than hardware specifications.
Most control rooms already have the screens. What they’re missing is the layer that decides what goes on them, and escalates automatically when something needs attention. By shifting your focus from hardware costs to the speed of human decision-making, you can build a defensible model based on risk reduction. This framework validates the need for vis/ability as your operational intelligence layer, providing the data required to approve a system that scales with your mission and creates a unified operating picture.
Key Takeaways
- Shift your financial focus from hardware specifications to the speed of human judgment and operational intelligence.
- Master a 5-step framework for calculating ROI for a new video wall system by quantifying risk reduction and response times.
- Identify the invisible costs of fragmented data streams and operator fatigue that traditional ROI models often overlook.
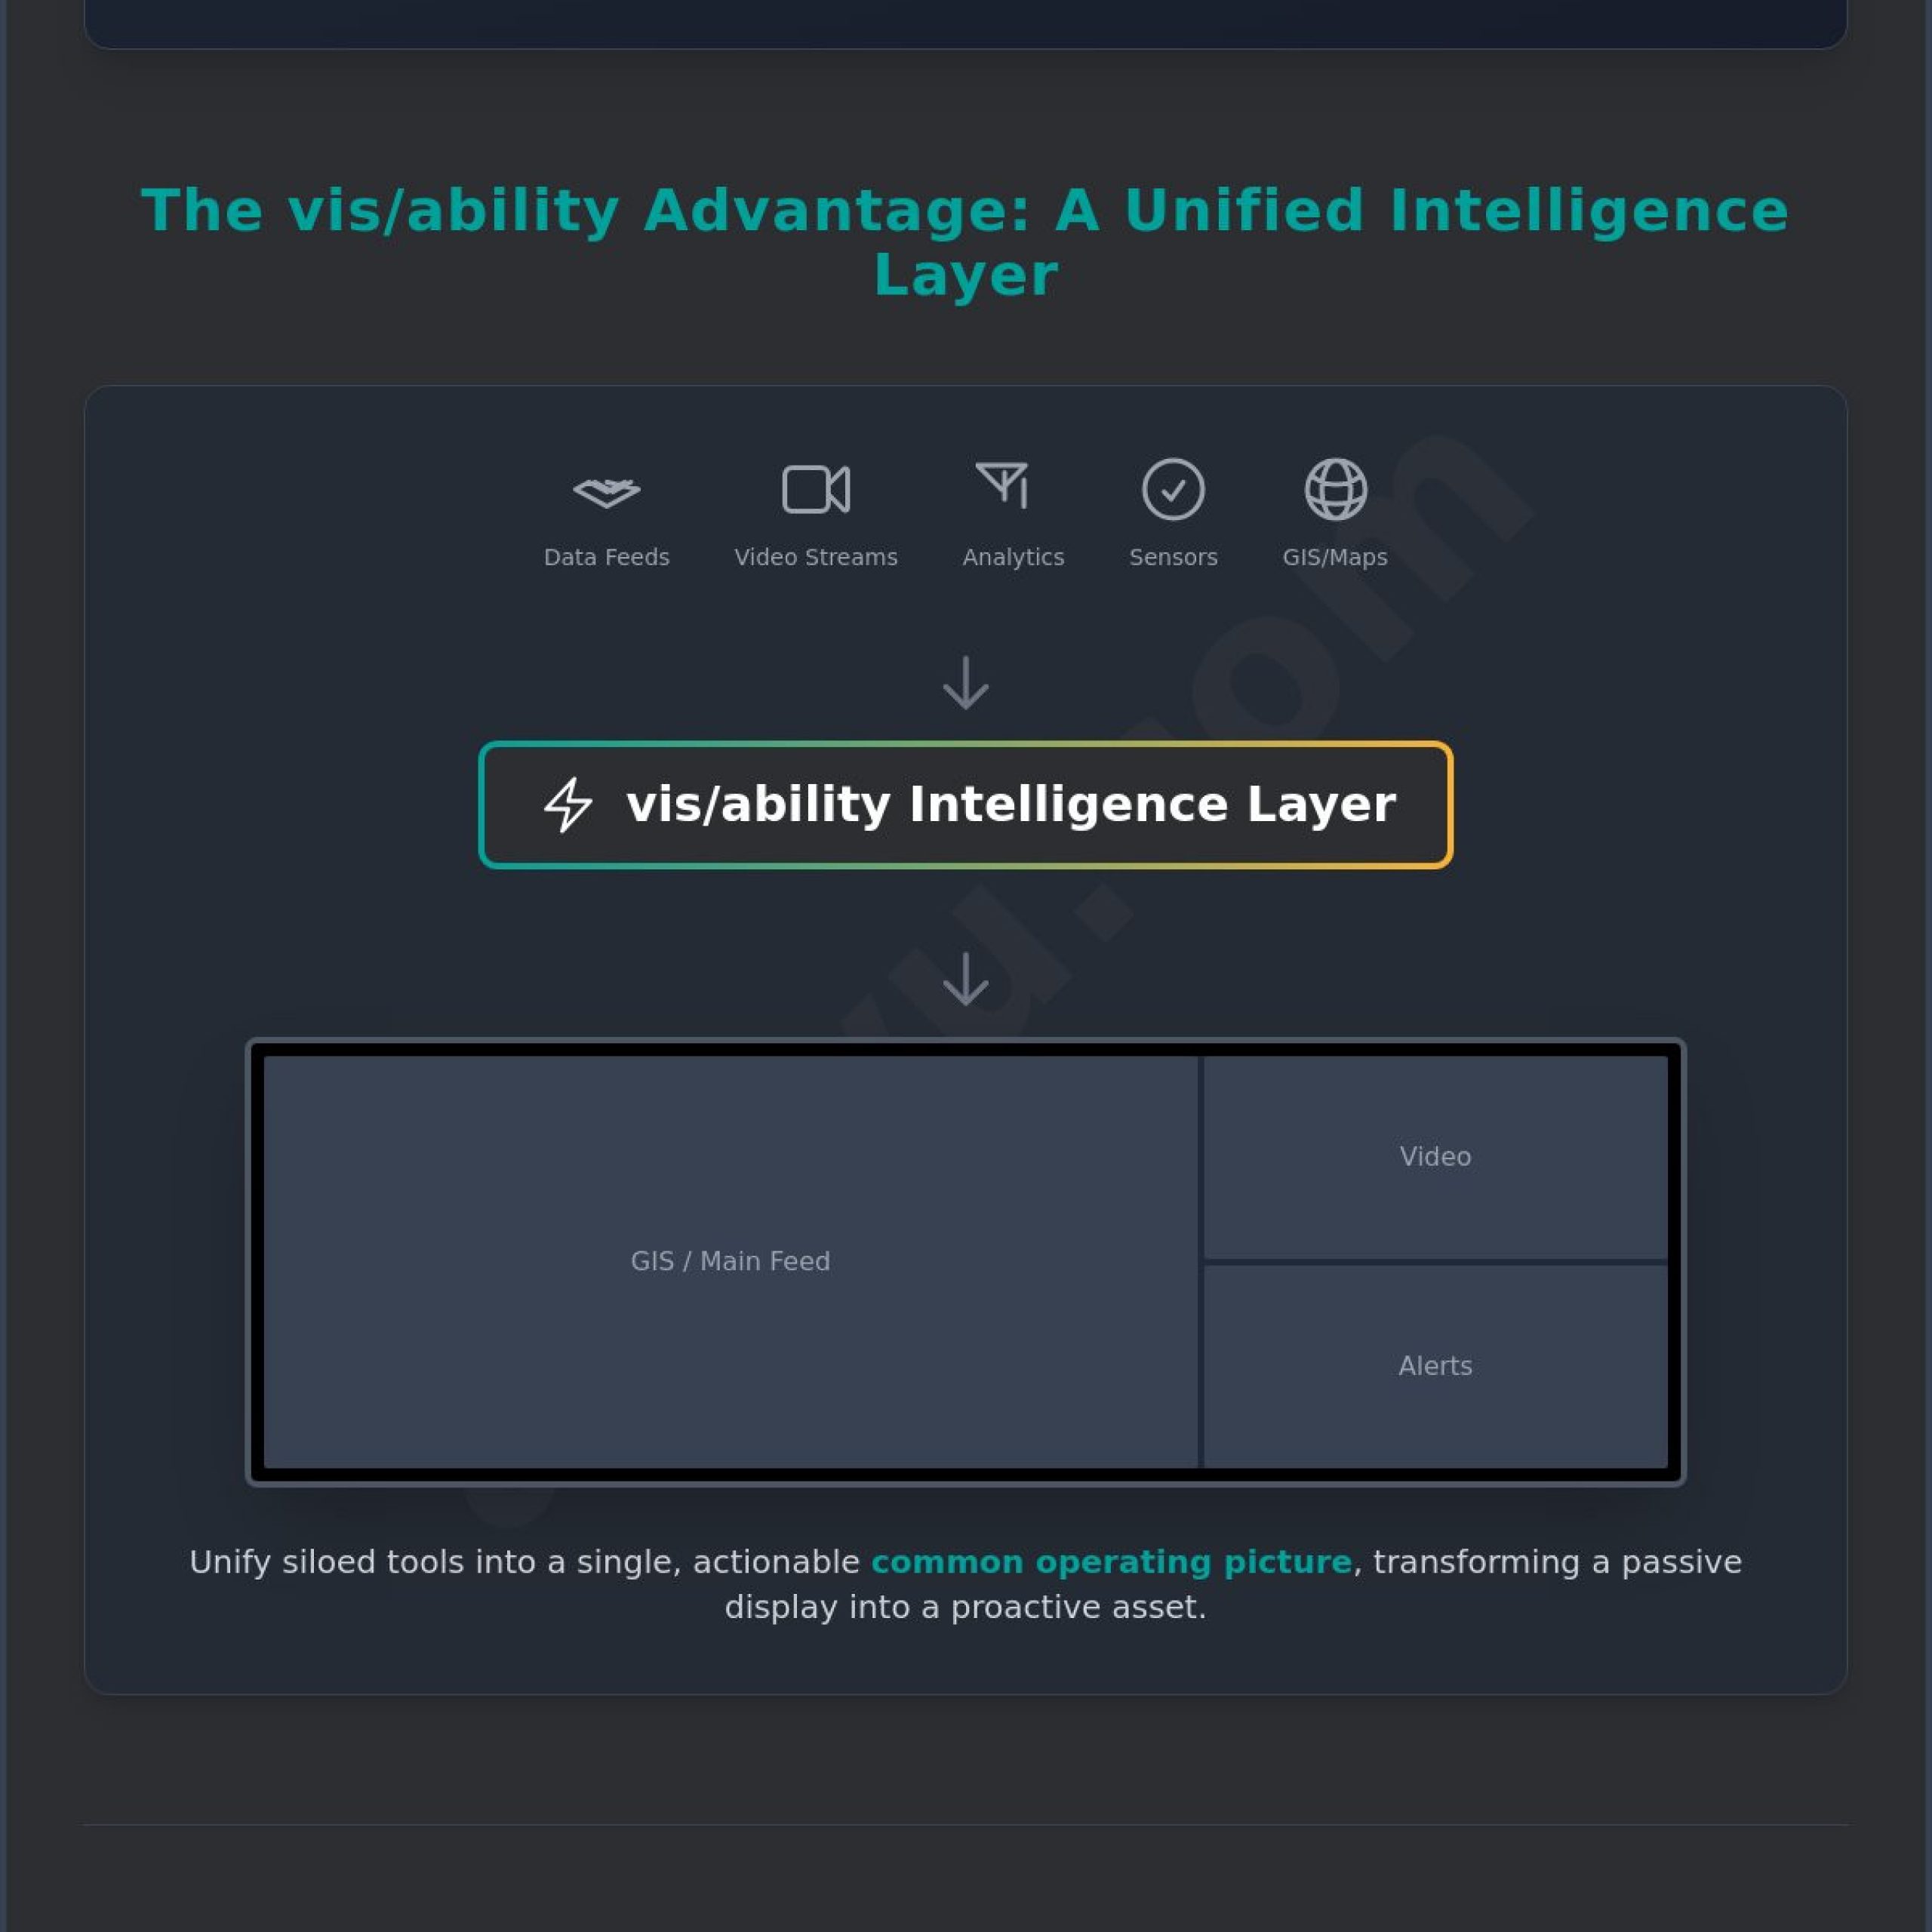
- Understand how an operational intelligence layer unifies siloed tools into a single, actionable common operating picture.
- Secure long-term approval by moving toward a software-defined architecture that scales without the risk of hardware obsolescence.
Beyond the Hardware: Why Standard ROI Models Fail in Control Rooms
Operational continuity depends on the speed of human judgment. When data is siloed across multiple platforms, operators struggle to maintain clarity. This fragmentation leads to delayed responses and increased risk. Traditional financial models often fail to capture these invisible costs. In high-stakes environments, the investment represents a strategic asset for operational continuity. Value is found in the seconds saved during a crisis rather than direct revenue generation. This reality makes calculating ROI for a new video wall system a challenge of quantifying time and risk. Formulas that work for retail or corporate lobbies don’t apply to a Security Operations Center (SOC) or Network Operations Center (NOC).
The Trap of Hardware-Centric Budgeting
Focusing on panel costs or pixel pitch often distracts from the true drivers of mission success. While a foundational understanding of what is a video wall provides a basic hardware baseline, the screens are merely the delivery mechanism. Budgeting based on equipment alone leads to “Siloed Visibility.” This occurs when high-resolution displays show disconnected data, forcing operators to manually bridge information gaps. This approach creates a false sense of security while leaving operational friction untouched. For organizations managing SOC and NOC environments, true value emerges when the system reduces the cognitive load on the human operator. Hardware-centric models fail because they don’t account for long-term operational gains or the cost of hardware obsolescence.
Operational Reality: The Cost of Fragmented Systems
Fragmented systems and siloed data create measurable drains on productivity. Operators frequently fall into “swivel-chair” patterns, physically moving between different monitors to correlate information from separate applications. This fragmentation introduces human error. Standalone data collection tools provide only partial situational awareness. They require a unifying layer to create a full common operating picture. Every second an operator spends searching for the right feed is a second lost in response time. This delay is an invisible operational cost that standard ROI models overlook. Key operational drains include:
- Fragmented Workflows: Operators spend significant time navigating between different software interfaces.
- Information Overload: Monitoring 20 or more disconnected screens leads to rapid fatigue and missed incidents.
- Partial Awareness: Specialized tools show only a fraction of the environment, leaving critical connections unseen.
Calculating ROI for a new video wall system must account for the cost of these delays. A system that unifies these streams into a single intelligence layer transforms the display into an active participant in the mission. It moves the operation from a reactive posture to a proactive one, ensuring that the human element remains the most effective part of the digital environment.
Quantifying the Intelligence Layer: The vis/ability Advantage
Most control rooms already have the screens. What they’re missing is the layer that decides what goes on them — and escalates automatically when something needs attention. This distinction is the primary factor when calculating ROI for a new video wall system. Standard displays are passive; they require constant human oversight to remain useful. An operational intelligence layer acts as the central hub into which all other tools flow. It prioritizes essential information, ensuring that the most critical data is always front and center during a pivotal decision. This shift from manual monitoring to automated awareness transforms your video wall from a capital expense into a proactive tool for risk mitigation.
The Intelligence Layer Defined
The vis/ability platform serves as the unifying architecture that makes other tools useful for the entire team. Many organizations rely on specialized situational awareness software for data analysis or geospatial oversight, but these tools often exist in silos. While these platforms provide vital insights, they typically offer a partial solution and require a unifying layer to create a full common operating picture. By Quantifying the Intelligence Layer, you move from a reactive posture to a proactive one. Event-driven automation justifies the system cost by replacing manual content management with logic-based triggers. When a sensor detects a breach or a system reaches a critical threshold, the video wall updates instantly, ensuring the right information reaches the right person at the right time.
Reducing Cognitive Load as a Financial Metric
In a high-stakes 24/7 environment, operator fatigue is more than a wellness issue; it’s a financial risk. Monitoring dozens of disconnected screens leads to rapid cognitive decline and missed incidents. Automated escalation solves this problem by filtering the data stream, preventing the alarm fatigue that often plagues dispatch centers and SOCs. This intelligence isn’t limited to the physical command center. Through Mobile vis/ability, the same common operating picture is available on mobile devices and in huddle rooms. This ensures that field responders and executives act with the same certainty as the operators on the floor. Reducing this cognitive load is a measurable metric in calculating ROI for a new video wall system, as it directly impacts the speed and accuracy of incident resolution. You can consult with our design team to build a defensible investment model for your specific environment.
Calculating the Cost of Inaction: Risk Mitigation and Response
In most commercial sectors, ROI is measured by how much money a system makes. In mission-critical environments, the metric shifts to Return on Prevention (ROP). This calculation measures how much money, time, and life a system saves by preventing a crisis from escalating. Whether you’re managing a power grid or a metropolitan emergency response, the cost of inaction far exceeds the capital investment of the technology. Calculating ROI for a new video wall system must account for the financial fallout of downtime, security breaches, and safety incidents. When an incident occurs, the difference between a controlled response and a catastrophic failure is often measured in seconds.
For utilities and energy providers, grid stability relies on the immediate detection of anomalies. A delay in identifying a transformer failure can lead to cascading blackouts, costing millions in lost productivity and regulatory fines. Similarly, in public safety, the speed at which a dispatcher can visualize a 911 caller’s location alongside live camera feeds determines the outcome of the emergency. Standard video walls that act as mere screen extensions don’t solve this; they only provide more data for the operator to manually sort through. True ROI comes from the intelligence layer that surfaces the most critical data before the situation spirals out of control.
The Value of Seconds in Incident Response
Every mission-critical operation follows the OODA loop: Observe, Orient, Decide, and Act. Fragmented systems lengthen this loop at every stage. If an operator has to log into multiple platforms to verify a security breach, they’re losing valuable time. Unified visualization accelerates this process by presenting a single, coherent view of the environment. You can quantify this by calculating the cost per minute of operational downtime. In many industrial settings, this number is staggering. By reducing the time it takes to “Observe” and “Orient,” the system allows for faster decision-making. This efficiency isn’t just about speed. It’s about accuracy. When operators see the full context of an event, they’re less likely to make errors that lead to further delays or costs.
Quantifying Improved Situational Awareness
A Common Operating Picture (COP) is the bedrock of risk mitigation. Standalone security platforms or data analysis tools provide only partial situational awareness. They show you what is happening in one silo, but they don’t show you how that event impacts the rest of your operation. Visualizing threat intelligence within a unified platform prevents catastrophic failures by connecting the dots between disparate data points. For instance, a cybersecurity alert in a NOC might be related to a physical breach seen in the SOC. Without a unifying layer, these two events remain disconnected until it’s too late. Calculating ROI for a new video wall system involves valuing the ability to see these connections in real-time. This visibility ensures that you aren’t just reacting to incidents, but staying ahead of them through a proactive, event-driven posture.
A 5-Step Framework for Calculating Video Wall ROI
Proving the value of a high-stakes technology investment requires a financial model that reflects the operational reality of your command center. Calculating ROI for a new video wall system involves quantifying the transition from a reactive posture to an event-driven one. This framework moves beyond the screen to measure the impact of intelligence on your mission. By focusing on measurable operational outcomes, you can build a case that satisfies both technical experts and financial stakeholders.
- Step 1: Audit existing data silos and blind spots. Identify every instance where an operator must manually correlate data between disconnected systems. These gaps are where incidents escalate unnoticed.
- Step 2: Calculate the Total Cost of Ownership (TCO). This must include the hardware, the operational intelligence layer, and control room design services. Hardware serves as the foundation, while the software layer drives the actual return over the system’s lifespan.
- Step 3: Estimate time-savings per incident. Use historical data to determine the average time to identify and resolve a critical event. Quantify how automated escalation reduces this window and prevents cascading failures.
- Step 4: Factor in operator retention and training. High-stress environments often suffer from high turnover. Reducing cognitive load through better visualization improves morale and lowers the recurring cost of training new personnel.
- Step 5: Project the value of future scalability. Consider the cost of adding new data streams or mobile users in three years. A software-defined system prevents the need for a total hardware overhaul when your needs evolve.
Step-by-Step Data Collection
Gathering the necessary data requires engagement with stakeholders across IT, Operations, and HR. Ask your IT team about the current burden of maintaining proprietary processors. Operations can provide metrics on response times and the frequency of “near-miss” incidents. HR can provide the specific costs associated with operator burnout and turnover. Look for hidden savings in your infrastructure, such as the ability to leverage COTS solutions to reduce your hardware footprint. Most control rooms already have the screens. What they’re missing is the layer that decides what goes on them, and escalates automatically when something needs attention. Collecting this data reveals the true cost of your current fragmented environment.
A Proactive Formula for High-Stakes Operations
When presenting to a CFO, frame the investment as a risk management strategy. A defensible formula balances your capital expenditure against the combined value of risk reduction and efficiency gains. Focus on the human element within the digital context. Explain how the technology empowers your team to act with greater certainty. The formula should reflect the value of a prevented disaster, the reduction in manual workflows, and the extension of hardware life through software updates. This logical progression creates a sense of trust, moving the conversation from hardware costs to operational readiness. To start building your specific framework, contact our design experts for a detailed operational audit.
Future-Proofing Your Investment with vis/ability
Future-proofing is the final pillar in calculating ROI for a new video wall system. While modern dvLED panels are rated for 100,000 hours of use, their long-term operational value is dictated by the intelligence driving them. A hardware-only approach leads to inevitable obsolescence as data streams and security protocols evolve. By choosing a software-defined architecture, you ensure that your investment remains a bedrock of resilience rather than a legacy burden. Most control rooms already have the screens. What they’re missing is the layer that decides what goes on them, and escalates automatically when something needs attention. This intelligence layer allows your system to adapt to new threats and technologies without requiring a complete hardware overhaul.
The ROI of your system extends far beyond the physical boundaries of the command center floor. When critical data is siloed within the SOC or NOC, decision-makers in huddle rooms or responders on mobile devices are left in the dark. Extending visibility to these distributed teams ensures that every stakeholder acts with the same certainty. This unified approach eliminates the communication gaps that lead to delayed responses. By integrating mobile vis/ability into your framework, you multiply the value of your initial investment across the entire enterprise, turning a single room into an organization-wide intelligence network.
Scalability as a Value Driver
Scalability serves as a primary value driver for mission-critical operations. Traditional systems often require expensive proprietary processors to add a single new video feed or data source. In contrast, the vis/ability platform allows you to integrate additional applications and data streams through software. This flexibility is vital for maintaining a cybersecurity common operating picture, where new threats and monitoring tools emerge daily. Because the system is built on an open, software-defined architecture, you can scale your operations without the “rip-and-replace” costs associated with closed hardware ecosystems. You can explore how these integrated environments function in our specialized SOC/NOC solutions.
Next Steps for Decision Makers
Transitioning from passive screens to active intelligence requires a partner who understands the high-stakes nature of your mission. We bring a 40-year history of engineering reliability into the world’s most demanding environments. Our solutions are designed to be the quiet, powerful engine behind your most critical decisions. Secure your operational future by requesting a professional control room design consultation. Our experts will help you move beyond hardware quotes to develop a customized ROI assessment. This analysis will provide the defensible financial and operational data you need to gain final approval for a system that scales with your organization and protects your mission for years to come.
Securing Your Mission-Critical Future
True operational value is measured by the clarity of human judgment at the moment of a pivotal decision. Moving beyond hardware costs allows you to build a defensible model for your organization. By focusing on risk mitigation and the speed of response, calculating ROI for a new video wall system becomes a strategic roadmap for resilience. You’ve seen how identifying invisible costs, such as operator fatigue and fragmented data silos, transforms the conversation from a capital expense into a vital operational asset.
Most control rooms already have the screens. What they’re missing is the layer that decides what goes on them, and escalates automatically when something needs attention. Activu provides this essential intelligence through event-driven automation, drawing on over 40 years of mission-critical experience. Our unified platform bridges the gap between raw data and action in NOC, SOC, and EOC environments. We invite you to Contact Activu for a customized ROI assessment of your control room. Empower your team to filter out the noise and act with the absolute certainty your mission demands.
Frequently Asked Questions
How do you measure ROI for a system that does not generate revenue?
ROI in mission-critical environments is measured through Return on Prevention and operational efficiency gains. You quantify the financial impact of avoided downtime, reduced response times, and the mitigation of catastrophic failures. By assigning a specific dollar value to every minute of operational continuity, you create a defensible model that justifies the capital expenditure. This approach shifts the focus from profit generation to risk management and mission success.
What are the most common hidden costs in a video wall project?
Hidden costs often include specialized programming, ongoing maintenance, and the recurring expense of proprietary hardware updates. Many organizations overlook the cost of spare modules, which typically require a budget of 2% to 5% of the total panel cost. Additionally, professional services like design and installation can account for 15% to 35% of the equipment cost. Factoring in these variables is essential for calculating ROI for a new video wall system accurately.
How does an intelligence layer like vis/ability improve the ROI compared to hardware alone?
An intelligence layer transforms passive displays into active decision support tools by automating data escalation. Most control rooms already have the screens. What they’re missing is the layer that decides what goes on them, and escalates automatically when something needs attention. This automation reduces the manual burden on operators, prevents alarm fatigue, and ensures that the most critical information is prioritized during high stakes events. This layer drives value by making existing data actionable.
Can we use existing screens and still see an ROI from a new system?
You can realize a significant return by overlaying an operational intelligence layer onto your current display infrastructure. The primary bottleneck in most command centers isn’t the resolution of the panels, but the fragmented nature of the data being displayed. By unifying disparate streams into a single operating picture, you improve decision making speed without the immediate need for a full hardware replacement. This strategy allows for a phased upgrade path that prioritizes intelligence over pixels.
How do you quantify situational awareness in a budget proposal?
Situational awareness is quantified by measuring the reduction in time between incident detection and human action. In a budget proposal, you should present this as a decrease in the OODA loop duration. Use historical data to show how many incidents were missed or delayed due to information silos. By demonstrating that a unified platform prevents these gaps, you frame situational awareness as a measurable tool for protecting organizational assets and ensuring public safety.
What is the typical payback period for a mission-critical video wall system?
The payback period varies based on the frequency and severity of the risks your organization manages. For many entities, a single prevented disaster or a 10% reduction in response times can cover the entire cost of the system within the first year. Calculating ROI for a new video wall system involves looking at long term operational resilience. Because software defined systems prevent hardware obsolescence, the total cost of ownership remains lower over the system’s lifespan.
How does mobile integration affect the overall ROI of a command center?
Mobile integration multiplies the value of your command center by extending the common operating picture to field responders and remote executives. This connectivity ensures that decisions made on the floor are executed with precision in the field. By reducing the need for verbal status updates and manual data relay, you improve overall mission coordination. This extension of visibility minimizes errors and ensures that the intelligence layer serves the entire organization, not just those in the room.