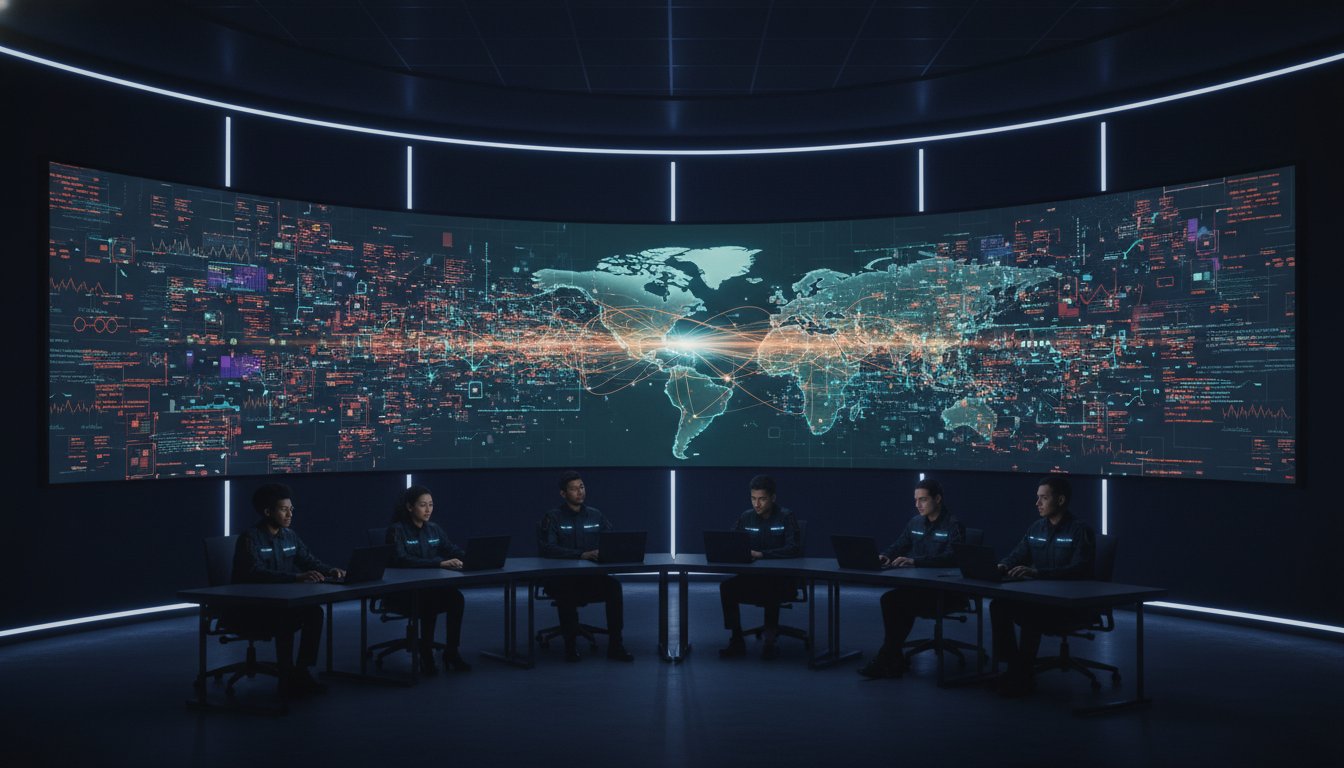
Organizations now take an average of 277 days to identify and contain security incidents, a delay that proves catastrophic when global cybercrime costs are hitting $10.5 trillion in 2026. You’re likely managing a barrage of alerts from disconnected SIEM and SOAR platforms, yet you still lack a clear view of your total risk profile. While many teams invest heavily in cybersecurity data visualization tools, most of these solutions simply add more noise to an already crowded screen. You don’t need more charts. You need a way to synthesize raw data into immediate, operational intelligence.
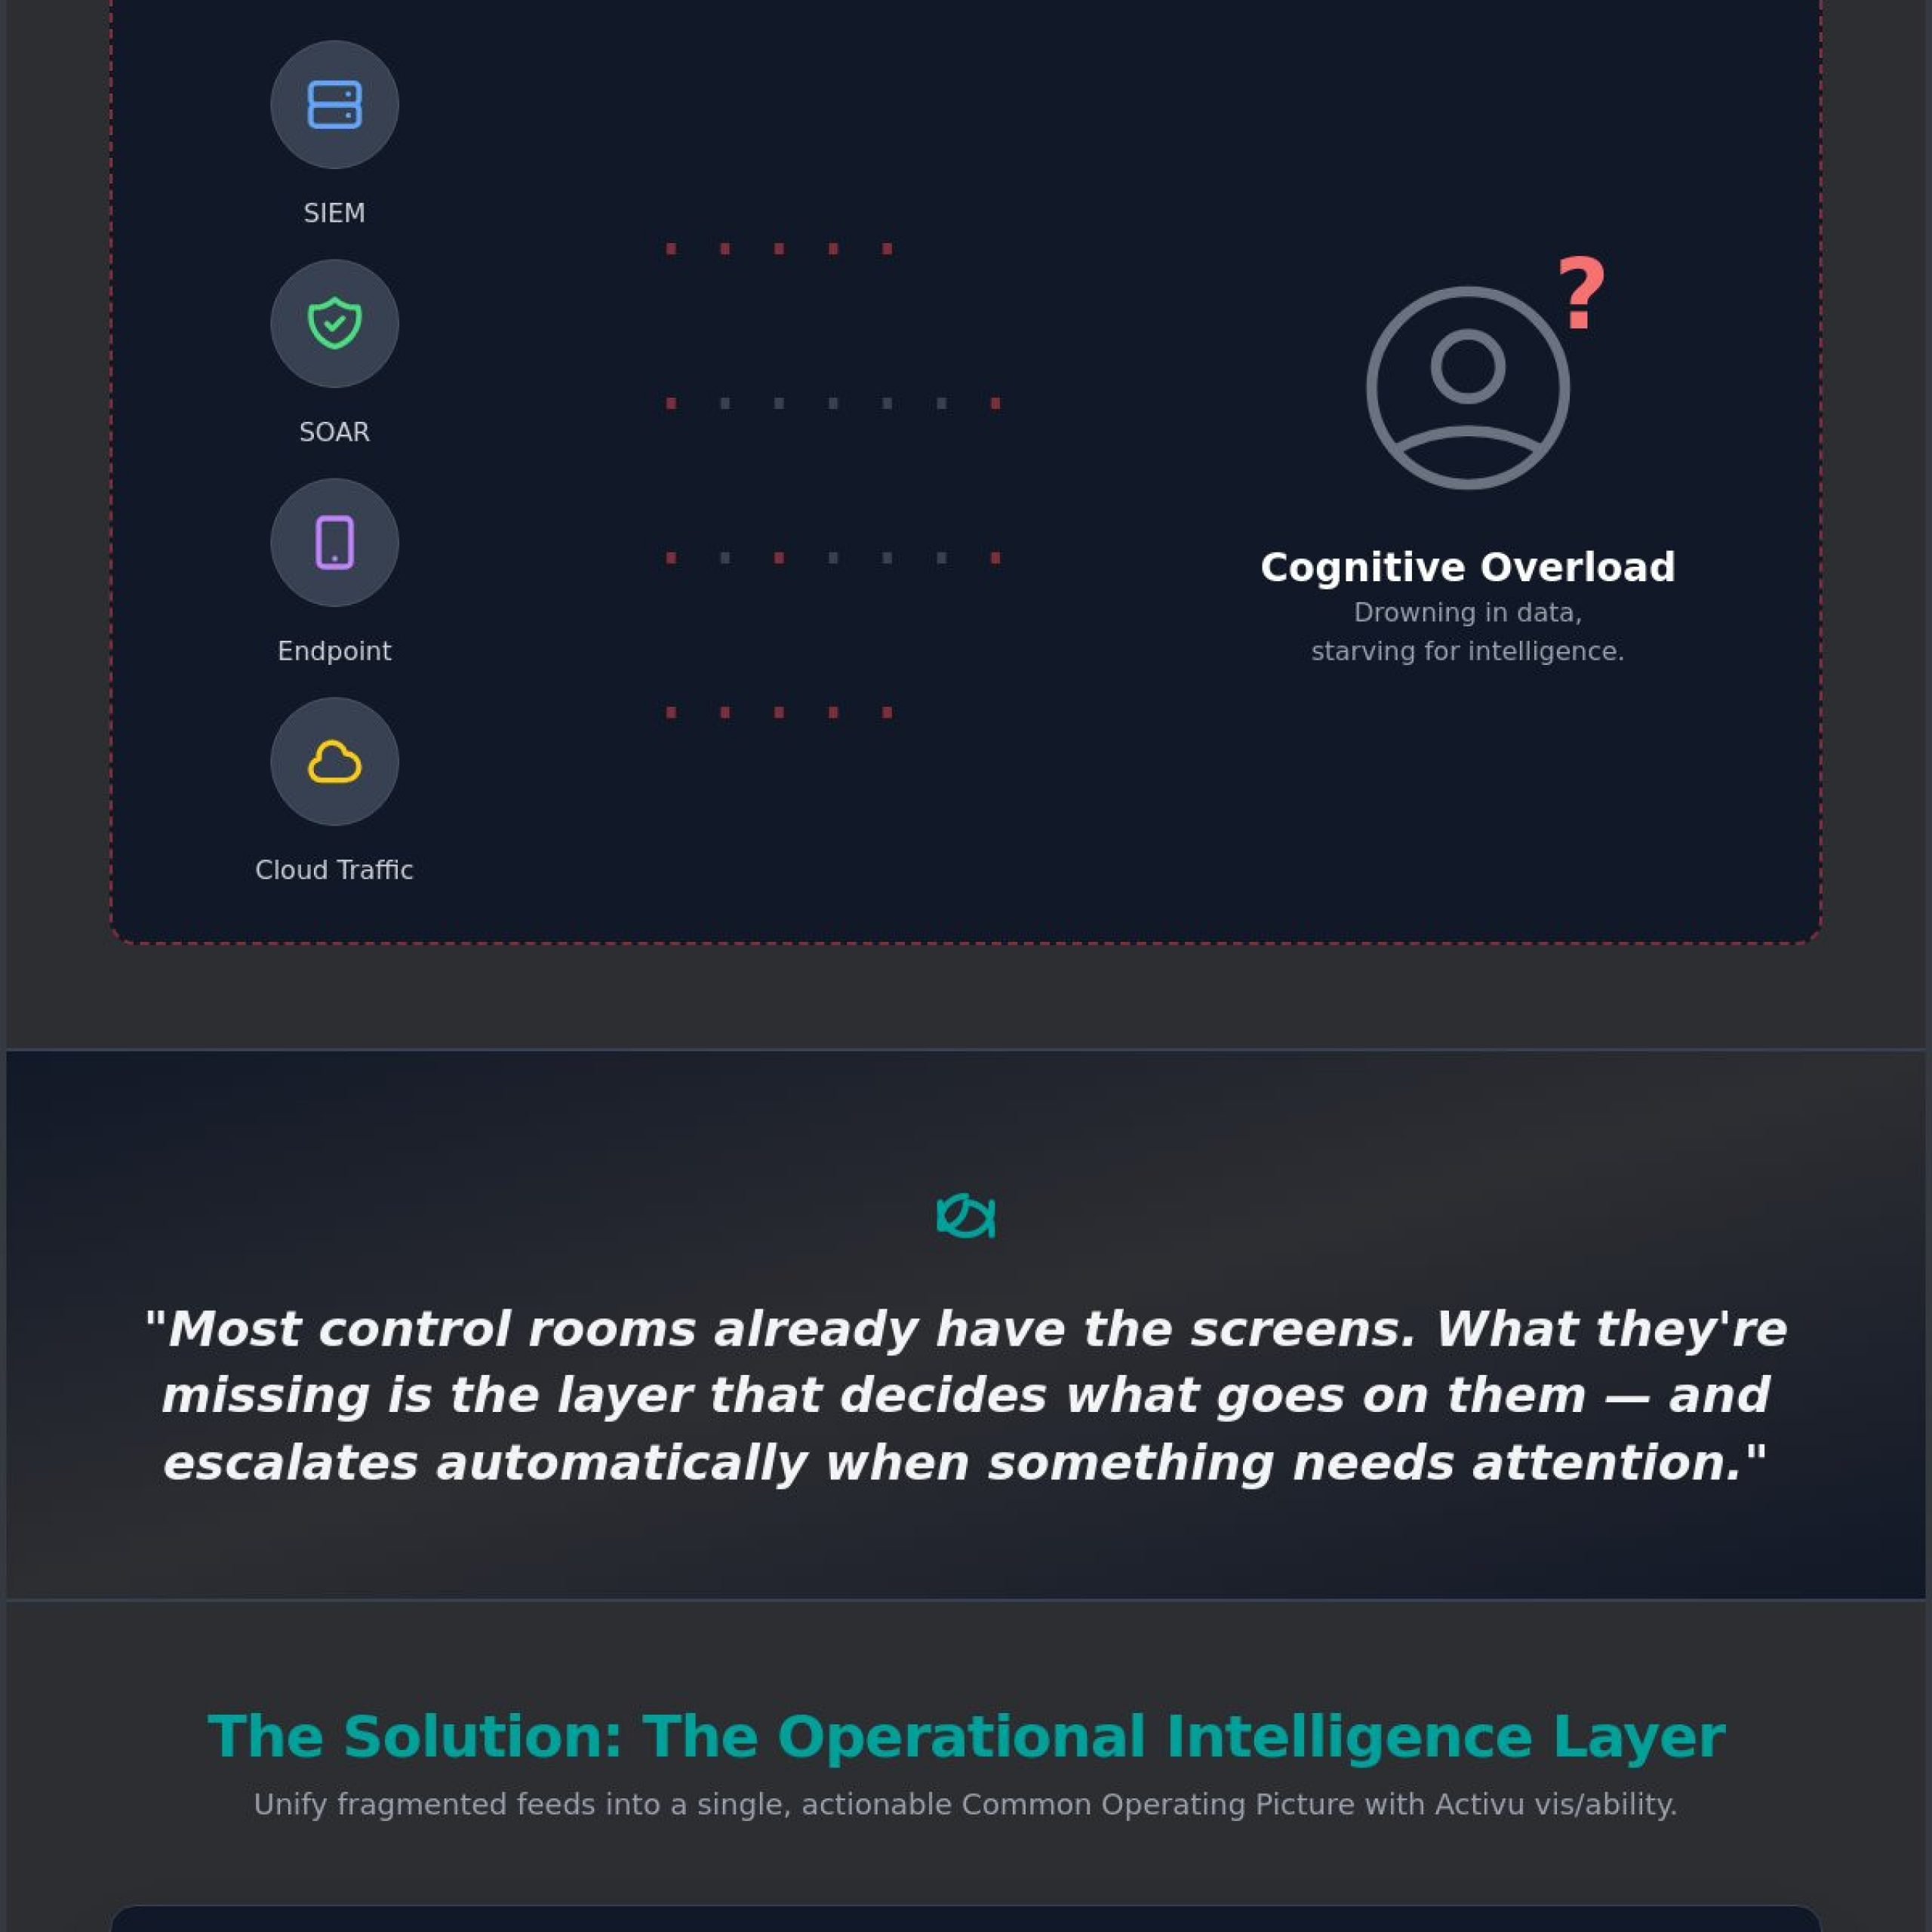
Most control rooms already have the screens. What they’re missing is the layer that decides what goes on them; it escalates automatically when something needs attention. This is the critical gap where vis/ability functions as your operational intelligence layer. By unifying fragmented feeds from tools like Axon, which often provide only a partial solution, you can finally establish a common operating picture across your entire enterprise. We’ll show you how to reduce cognitive overload and ensure your distributed teams collaborate effectively when stakes are at their highest.
Key Takeaways
- Identify why the “Siloed Dashboard Trap” prevents effective response and how to transition from fragmented feeds to a unified common operating picture.
- Evaluate cybersecurity data visualization tools based on their capacity to serve as a strategic bridge between raw telemetry and human judgment.
- Understand why most control rooms have the screens but lack the layer that decides what goes on them; learn to automate these escalations for faster response.
- Discover a step-by-step framework for auditing existing data silos and defining the triggers that drive event-driven situational awareness.
- See how the vis/ability platform unifies video, data, and application streams to provide absolute clarity for distributed security teams during critical incidents.
The Reality of Fragmented Cybersecurity Data Visualization
Effective Security visualisation serves as the strategic bridge between raw network telemetry and the human judgment required to neutralize a threat. It’s the process of translating millions of disparate data points into a format that allows a human operator to perceive patterns, identify anomalies, and act with certainty. However, the current reality for most security operations centers is far from this ideal. Instead of clarity, teams face a fragmented landscape of disconnected interfaces that obscure more than they reveal.
The primary obstacle is the “Siloed Dashboard Trap.” Most organizations deploy multiple cybersecurity data visualization tools, each dedicated to a specific niche like endpoint detection, cloud traffic, or identity management. While these tools are individually powerful, they operate in isolation. They provide a deep but narrow view of the environment, forcing analysts to mentally stitch together a complete picture from a dozen different screens. This manual synthesis is slow, prone to error, and unsustainable during high-velocity attacks.
The High Cost of Fragmented Visibility
Fragmented visibility creates significant operational risks that directly impact the bottom line. When data remains siloed, critical correlations go unnoticed. An unusual login attempt in one system might seem benign until it’s viewed alongside a simultaneous data egress alert in another. Without a unified view, these connections remain invisible until the damage is done. This lack of context is why organizations take an average of 277 days to identify and contain security incidents.
This fragmentation also leads to severe operator fatigue. Monitoring dozens of independent feeds causes cognitive exhaustion, which increases the likelihood that a subtler, more dangerous signal will be missed. The problem is rarely a lack of data; it’s almost always a lack of unified context. Organizations are drowning in information but starving for the intelligence that comes from seeing all relevant feeds in one place.
Why Raw Security Data Fails in High-Stakes Moments
During an active breach, traditional charts and graphs are insufficient for mission-critical situational awareness. There’s a fundamental difference between seeing data and understanding an operational reality. A bar chart showing increased packet loss doesn’t communicate the urgency of a server room failure or a coordinated ransomware deployment. Raw data requires interpretation, and in a crisis, time spent interpreting is time lost to the adversary.
Cognitive overload is the enemy of decisive action. When stakes are at their highest, leaders can’t afford to waste seconds navigating between disconnected security platforms. Most control rooms already have the screens. What they’re missing is the layer that decides what goes on them; it escalates automatically when something needs attention. Without this operational intelligence layer, the human element is sidelined by the very cybersecurity data visualization tools meant to empower it. True situational awareness requires a platform that filters the noise and presents only the essential information needed to act.
Evaluating Cybersecurity Visualization Tools: A Strategic Framework
Selecting the right cybersecurity data visualization tools requires a shift in perspective. You shouldn’t evaluate these platforms based on a checklist of chart types or color palettes. Instead, you must assess how a tool integrates into your existing Security Operations Center (SOC) ecosystem. The goal is not just to see data but to facilitate a rapid transition from detection to neutralisation. Complex environments demand more than just graph SDKs that require months of custom development. You need a solution that works immediately with the tools you already own. Researching the methodology for evaluating cybersecurity visualization tools reveals that unified standards and clear evaluation metrics are essential for maintaining operational readiness.
Many organizations rely on specialized platforms like Axon or native SIEM dashboards to monitor their environment. While these tools provide valuable telemetry, they are often partial solutions. They excel within their specific domains but fail to provide a common operating picture across the entire enterprise. When an incident occurs, an analyst shouldn’t have to jump between three different interfaces to understand the scope of a threat. Relying on these fragmented views creates a disjointed response strategy. You need a unifying layer that aggregates these streams into a single, authoritative view.
From Static Dashboards to Dynamic Intelligence
Traditional monitoring relies on static dashboards that remain unchanged until a human interacts with them. This approach is reactive and dangerous. Mission-ready visualization must be event-driven. It should respond to the environment in real time, shifting focus as threats evolve. Most control rooms already have the screens. What they’re missing is the layer that decides what goes on them; it escalates automatically when something needs attention. This automated escalation ensures that your team sees the most critical information the moment it matters. It transforms the video wall from a passive display into an active participant in your security posture.
Integration Requirements for SIEM and SOAR Data
A truly effective visualization platform must ingest and normalize data from your entire security stack, including SIEM, SOAR, and cloud metadata. Native tool dashboards don’t talk to each other, which leaves your team to bridge the gaps manually. The vis/ability platform serves as the central hub for these disparate streams. It removes the technical friction of data integration, allowing your team to focus on decision-making rather than data management. By unifying these feeds, you ensure that every member of the team, from the SOC floor to mobile responders, shares the same intelligence. You can speak with our team to learn how to unify your current security feeds into a single operational layer.
The Operational Intelligence Layer: Unifying Distributed Security Teams
Most cybersecurity data visualization tools are designed for the individual analyst sitting at a workstation. This creates a dangerous bottleneck during critical incidents. When a threat scales, the response must scale with it, requiring a transition from solo monitoring to collective action. True security leadership depends on a Common Operating Picture (COP) that transcends individual dashboards. It ensures that every stakeholder, from the front-line analyst to the Chief Information Security Officer, observes the same operational reality in real time.
Most control rooms already have the screens. What they’re missing is the layer that decides what goes on them; it escalates automatically when something needs attention. This distinction is vital. Without an operational intelligence layer, your video wall is merely a collection of static monitors. With it, the wall becomes an active participant in your defense strategy, automatically surfacing the most critical telemetry when specific threat thresholds are met. This level of automation ensures that your team remains focused on the mission rather than the mechanics of data management.
A unified layer empowers team members across the entire enterprise. It doesn’t matter if an operator is in the primary command center, a remote huddle room, or responding via a mobile device. They must all share the same visual context. This synchronization eliminates the need for verbal descriptions of visual data, which are often slow and prone to subjective error. When everyone sees the same incident unfolding, the path to a decision becomes clear and inevitable.
Collaborative Decision-Making in Crisis
Consider the workflow of a SOC team during a major ransomware or DDoS event. Analysts are often buried in technical telemetry while executives demand immediate status updates. A shared visual environment prevents communication breakdowns by allowing the SOC to push specific, high-level views to executive huddle rooms instantly. Everyone looks at the same attack vectors and mitigation progress simultaneously. This seamless integration is a core component of effective SOC/NOC solutions, where environmental context dictates the speed of your response.
The Limitations of Standalone Threat Intelligence Platforms
Some organizations utilize specialized platforms like Axon to gather deep threat intelligence. While these tools provide essential data, they offer only a partial view of the total operational landscape. They are technical silos that require a unifying layer to become useful for the broader operation. We must prioritize the human element within the digital context of a security hub. By funneling specialized data into a central hub, you empower your people to act with greater certainty. Intelligence is only valuable when it is accessible, visual, and actionable for the entire team.
Implementation Strategies for Enterprise-Scale Threat Visualization
Deploying cybersecurity data visualization tools at an enterprise scale requires a methodical strategy that prioritizes operational outcomes over technical features. You must bridge the gap between raw data collection and the “last mile” of human decision-making. This process begins by identifying why operators miss incidents on a video wall, which is often due to a lack of prioritized information. To move from fragmented feeds to a unified common operating picture, follow these five essential steps:
- Audit Existing Data Silos: Identify every platform, from SIEM and SOAR to specialized tools like Axon, where visibility gaps compromise your response time.
- Define Escalation Triggers: Determine the specific threat thresholds that should automate what content appears on the shared visual environment.
- Establish a Single Source of Truth: Integrate all telemetry into a central hub to ensure every stakeholder observes the same data.
- Design for Cognitive Clarity: Structure the visual environment to minimize noise and highlight only the most critical information.
- Extend Visibility: Ensure that the operational intelligence layer is accessible to mobile and remote stakeholders to maintain continuity.
This structured approach solves the problem of how to manage multiple data feeds in a dispatch center or SOC. By focusing on the workflow rather than the hardware, you ensure that your technology serves the mission.
Designing for Operator Focus and Reduced Fatigue
Information ergonomics is a critical factor in SOC performance. When analysts are presented with too much data, cognitive paralysis sets in. We advocate for “black screen” monitoring, a strategy where screens remain uncluttered until a specific incident occurs. This approach preserves operator focus for the moments that demand absolute precision. It’s a foundational element of operational continuity, ensuring that your team maintains mission-critical resilience even during prolonged crises. By reducing the ambient noise, you empower your analysts to identify subtler threats that would otherwise be lost in a sea of static dashboards.
Automating Escalation and Workflow Integration
Event-driven intelligence removes the burden of manual screen management from your security team. Most control rooms already have the screens. What they’re missing is the layer that decides what goes on them; it escalates automatically when something needs attention. The vis/ability platform acts as the quiet engine behind this process. It handles the technical complexity of integrating diverse data streams, allowing your analysts to transition from reactive monitoring to proactive situational awareness. This automation ensures that the right information reaches the right person at the right time, whether they are in the command center or responding via a mobile device. Speak with our experts to begin designing a visualization environment that automates your critical workflows.
Activu vis/ability: The Unified Common Operating Picture for Cybersecurity
The vis/ability platform serves as the bedrock upon which critical security decisions are made. While other cybersecurity data visualization tools function as isolated components, vis/ability acts as the overarching operational intelligence layer. It aggregates real-time telemetry, live video, and critical application streams into a single, authoritative view. This consolidation ensures that your team is no longer searching for the truth across multiple monitors; instead, the truth is presented clearly, allowing for immediate action. Most control rooms already have the screens. What they’re missing is the layer that decides what goes on them; it escalates automatically when something needs attention.
Our approach differs fundamentally from competitors who offer only SDK-level components for custom tool building. Those solutions require significant internal development and often fail to bridge the gap between disparate systems. Activu provides a complete, end-to-end environment designed for the high-stakes reality of modern security operations. By creating a cybersecurity common operating picture, we provide the steady reassurance that comes from absolute technical reliability. You gain the ability to move with a purposeful flow from threat detection to neutralized risk.
Transforming Isolated Feeds into Actionable Intelligence
Activu bridges the critical gap between the raw output of your security stack and a strategic overview. Specialized tools like Axon provide deep data, but they lack the scope to inform an entire enterprise response. By funneling these streams into vis/ability, you create a unified environment that is equally effective for the SOC floor and executive leadership. This capability is particularly vital in federal government and defense environments, where the speed of intelligence directly impacts national security. For a deeper look at establishing organizational resilience, refer to our Mission Critical Operations Guide.
Collaborate with Confidence Across the Enterprise
Security is a team discipline, and vis/ability empowers every individual to act with greater certainty. It ensures a seamless transition of intelligence between the command center, huddle rooms, and mobile responders. A common objection is that a new platform might replace existing investments. In reality, vis/ability does not replace your cybersecurity data visualization tools; it makes them useful for the entire team by removing the silos that keep data hidden from those who need it most. It serves as the quiet, powerful engine that maintains focus when stakes are at their highest. Concluding your search for fragmented solutions allows you to achieve a state of calm and clarity. Contact Activu for a tailored SOC design consultation to begin unifying your security operations.
Secure Your Operational Future with Unified Intelligence
Transitioning from fragmented dashboards to a unified common operating picture is a strategic necessity. By auditing your data silos and implementing event-driven situational awareness, you ensure that your team remains focused on neutralizing threats rather than managing interfaces. Modern cybersecurity data visualization tools must function as more than just passive displays; they must serve as the proactive intelligence layer that unifies your entire command structure. Most control rooms already have the screens. What they’re missing is the layer that decides what goes on them; it escalates automatically when something needs attention.
The vis/ability platform provides this critical layer. Trusted by Federal Government and Defense agencies, our solution reduces incident response time through automated escalation and provides seamless integration with your existing SIEM, SOAR, and VMS tools. This technical reliability establishes the bedrock upon which your most critical security decisions are made. You can Request a Demo of the vis/ability Platform to see how we transform complexity into actionable clarity. Take the final step toward a more resilient and responsive security operation today.
Frequently Asked Questions
What is a cybersecurity common operating picture (COP)?
A cybersecurity common operating picture is a unified visual environment that aggregates all security telemetry into a single, authoritative view. It provides a shared context for every stakeholder, from front-line analysts to executive leadership. This synchronization ensures that everyone observes the same operational reality in real time, which is essential for coordinated response during high-stakes incidents.
How does a COP differ from a standard SIEM dashboard?
A common operating picture functions as an operational intelligence layer that sits above standard SIEM dashboards. While SIEM tools provide deep technical data, they’re often siloed and difficult for non-technical stakeholders to interpret. A COP unifies these feeds with other sources like SOAR and VMS to create a holistic view for the entire team, enabling faster decision-making across the enterprise.
Why do security operators experience cognitive overload during incidents?
Cognitive overload occurs when security operators must manually synthesize data from dozens of disconnected cybersecurity data visualization tools. This fragmentation forces analysts to switch contexts constantly, which increases the risk of missing subtle but critical threat indicators. Reducing this noise is vital for maintaining focus and clarity when stakes are at their highest and time is a critical factor.
Can vis/ability integrate with existing tools like Axon or Splunk?
Yes, vis/ability integrates seamlessly with existing platforms like Axon, Splunk, and other SIEM or SOAR solutions. It functions as the central hub that ingests these specialized feeds and makes them accessible to the broader operation. This ensures that your existing investments become more useful for everyone, including mobile users and remote stakeholders who need immediate access to intelligence.
How does event-driven visualization improve incident response times?
Event-driven visualization improves response times by automating the escalation of critical information. Most control rooms already have the screens; what they’re missing is the layer that decides what goes on them; it escalates automatically when something needs attention. This removes the manual burden of screen management and allows your team to act with greater certainty the moment a threat is detected.
Is it possible to extend SOC visibility to mobile devices securely?
Extending SOC visibility to mobile devices is a core capability of the vis/ability platform. It provides a secure, synchronized view of the common operating picture for stakeholders outside the command center. This ensures operational continuity by keeping field responders and remote executives informed through the same visual context used in the main SOC, regardless of their physical location.
What are the key components of an effective cybersecurity video wall?
The most effective cybersecurity data visualization tools for a video wall prioritize clarity and collaborative potential over raw data volume. Key components include real-time data aggregation, event-driven triggers, and the ability to share specific views across different locations. A video wall should serve as an active participant in your defense strategy rather than a passive display of static charts.
How do you reduce operator fatigue in a 24/7 security operations center?
Reducing operator fatigue requires a strategy of information ergonomics and “black screen” monitoring. By only surfacing data when a specific incident occurs, you preserve the mental capacity of your analysts for high-stakes decision-making. This approach minimizes constant visual noise and ensures that the human element remains sharp and analytical in 24/7 environments where vigilance is mandatory.